
Lasernote user manual
To start measuring and sketching with Lasernote, we recommend the Lasernote video tutorials
Foreword
Program purpose
Lasernote connects to Bluetooth laser distance meters and provides tools for drawing site sketches based on measured lengths. It eliminates the need to manually draw on-site sketches with handwritten dimensions, making the entire measurement process more efficient and error-proof.
Features
- Connect to laser measure via Bluetooth to read the distances
- Draw site plan according to measured values
- Impose measured dimensions on pictures
- Align the measurement data
- Organize and browse the sketches
- Export the data in various file formats (pdf, jpg, dxf)
Lasernote is not aimed as CAD software. It is optimized for efficient on-site work. Therefore, the drawing decoration capabilities are limited to the ones that are needed to create readable, clear-cut site sketch. Instead, Lasernote offers:
- simple usage,
- few clicks per operation,
- offline work without registration,
- low battery consumption.
Getting started
Installation
Application will run on mobile devices with Android version 10 or higher, with Bluetooth version at least 4.0. There are no special hardware requirements. When needed, application will ask for permissions that are necessary to run Bluetooth, camera or access to device data storage. No data is being collected, stored or transferred without explicit user request. Application can only be installed via Play Store.
First use
On a first launch you will be asked to specify how to use the application. There are 2 options:
- Lasernote Standard - fully functional application with no limitations;
- Lasernote Free – usable application, but with limited functionality.
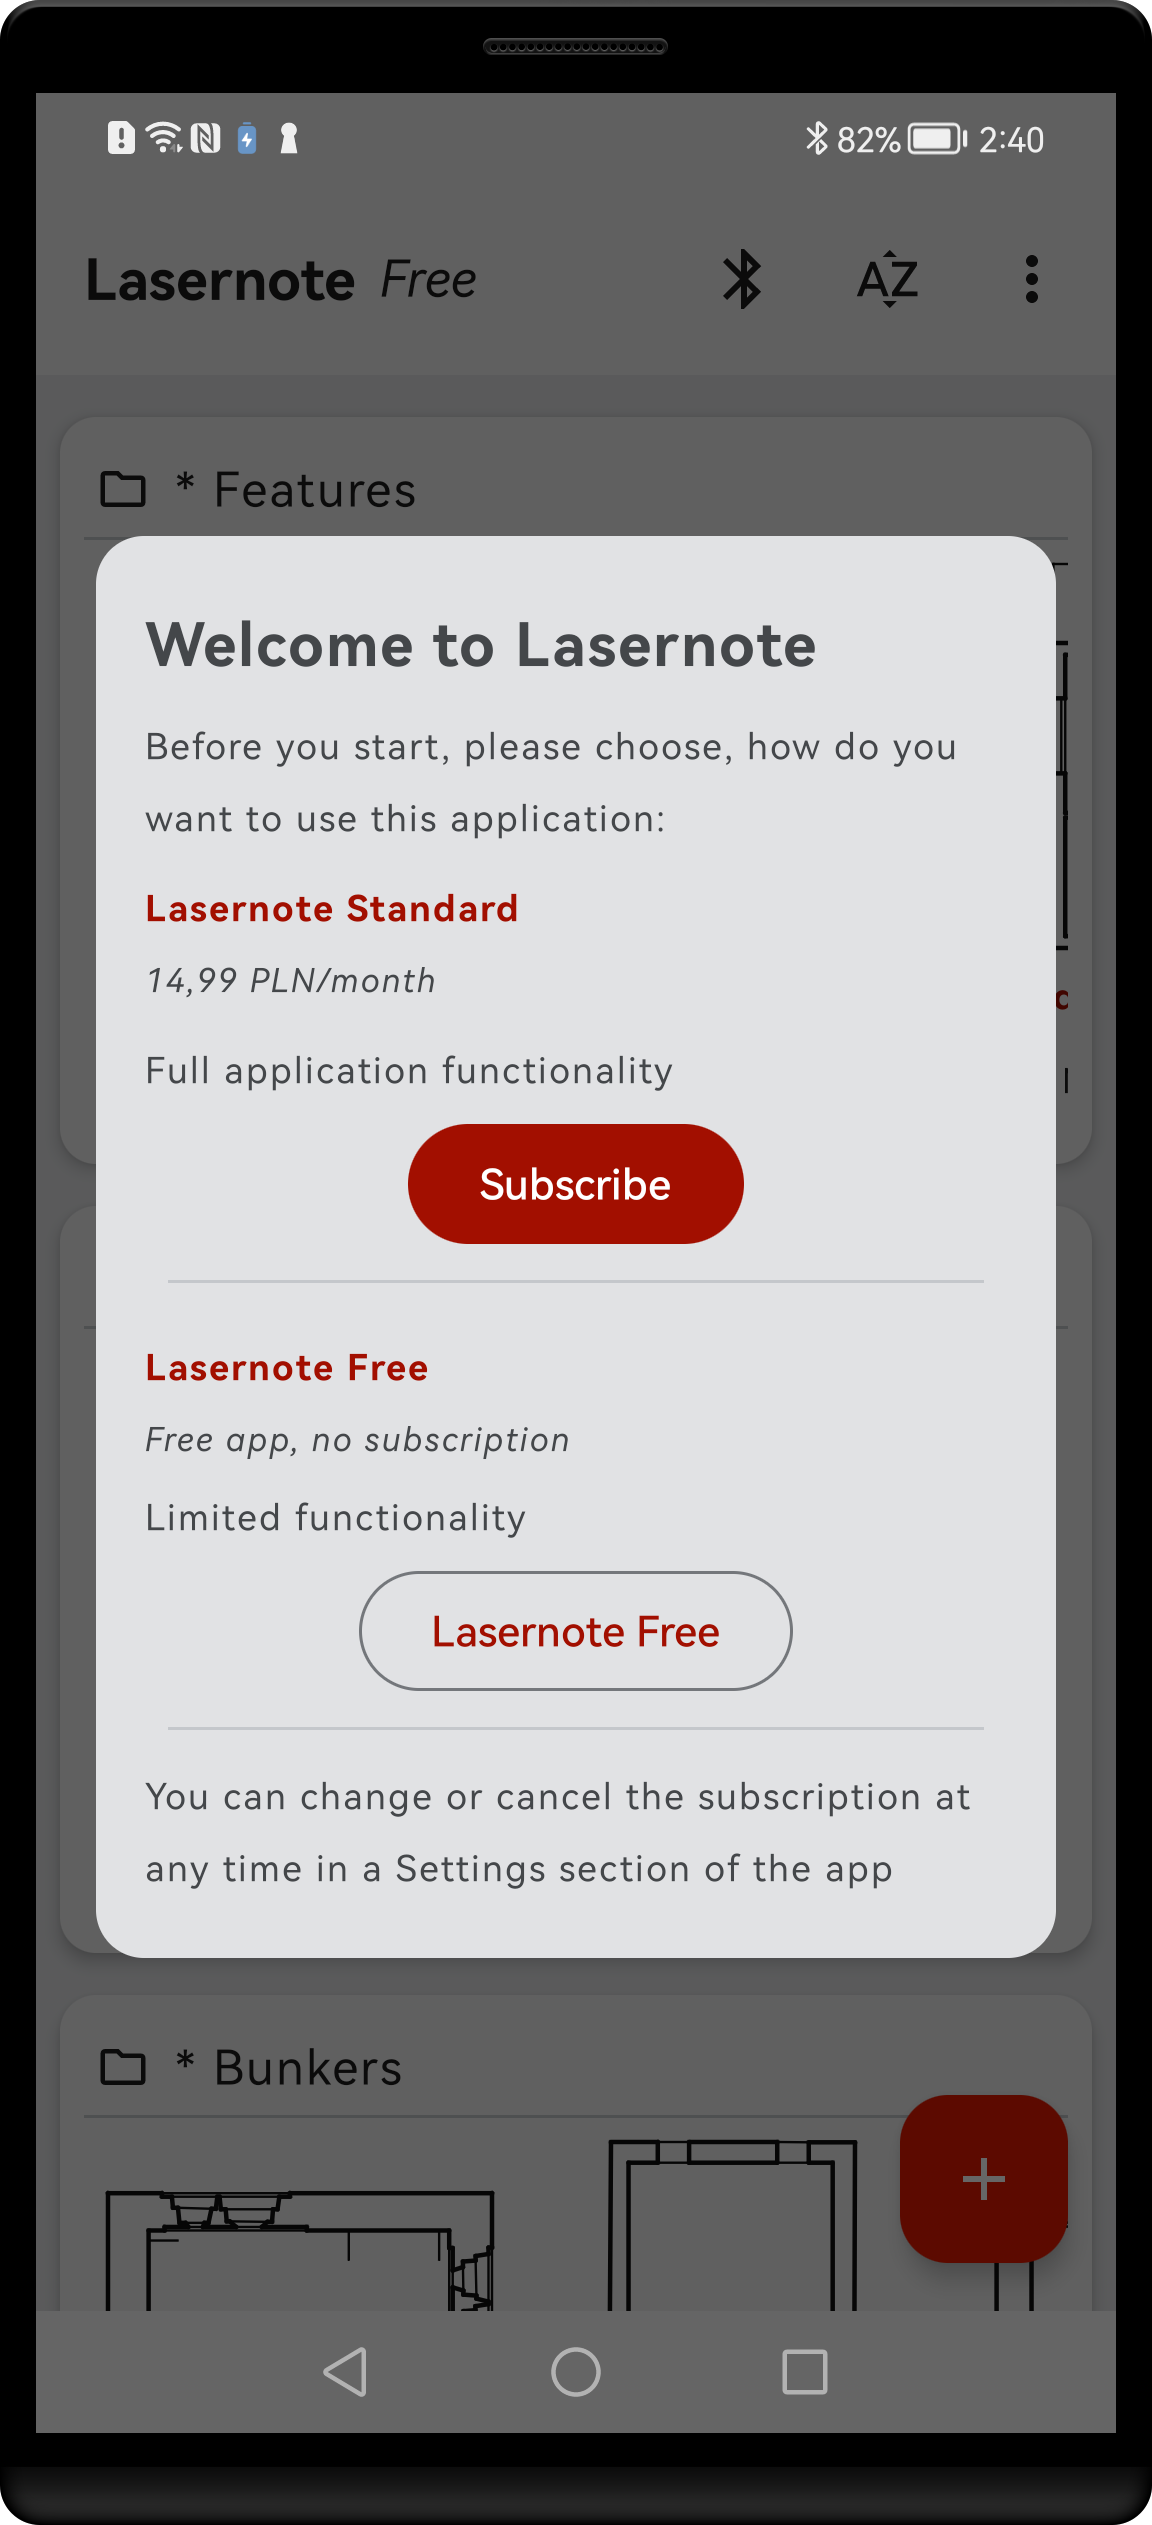
Application welcome screen. Choose between subscription and free version. If you want to do it later, hit Lasernote Free. You can change the subscription status at any time in the Application settings.
| Lasernote Free | Lasernote Standard | |
|---|---|---|
| Browse and view plans | Yes | Yes |
| Create, measure and edit plans | 5 plans * | Unlimited |
| Align measurement data | - | Yes |
| Export vector data to DXF file | - | Yes |
| Price | Free | 3 EUR/month ** |
If you plan to use Bluetooth connection, you have to tap the Bluetooth icon and open Bluetooth screen. You will be asked to grant the necessary permissions. Once the permissions have been granted, there is no need to repeat this procedure.
Lasernote quickstart
We have prepared video tutorials with three exercises that allow the beginners to jump into Lasernote. If you are new to the app, we strongly encurage to try these tutorials before reading the rest of the manual. You will learn how to:
- conduct basic wall measurements;
- conduct series and branched measurements;
- decorate the sketch.
Proceed to Lasernote video tutorials
Demo plans
Example plans are provided for demonstration of application features and to educate user how to implement styles and symbols correctly, as intended by application authors. They are grouped in 4 projects.
Buildings
Plans of the typical buildings, containing all important elements of the typical plan, from the wall layout with door, windows and construction elements, to equipment, furniture and installations.
Cottage split survey
Kind of survey in which the rooms are sketched as separate plans. The example building “Cottage” from previous project is used here.
Features
Application examples of various plan features: opening types (doors and windows), view of the wall with furniture and installations, detailed measurement of a window.
Bunkers
Use case with several smaller objects of non-typical kind surveyed with Lasernote.
Conventions
Basic concept
One of the most important concepts utilised in Lasernote is a separation between measurement and drawing. The same actually happens in real life: when you do measured survey you start with some measurement procedure and you end up with ready plan that you show to your client. These two worlds are clearly separated, with the field sketch acting as kind of link between them. In Lasernote things are organized in two primary layers:
- Measurements layer containing the net of measured angles and distances (observations)
- Shapes layer containing symbols for walls, windows, equipment, installations and other details of interest.
This arrangement is reflected in tool sets available in program. They can be respectively divided in two groups:
- Measurement tools controlled by tap, double tap and drag gestures,
- Drawing tools controlled by long press gestures.
GUI
Graphical user interface consists of several screens, dedicated to various use areas.
Main screen (plans browser)
Main screen is displayed upon program startup. You can access this screen from other screens by tapping Back navigation icon, located on a left side of top bar.
Main screen top bar contains following icon buttons:
- Bluetooth – navigate to Bluetooth screen
- Sort order – choose sort order for plans’ list
- Load plan from file – open system file picker to load plan from external file
- Application properties – navigate to Application properties screen
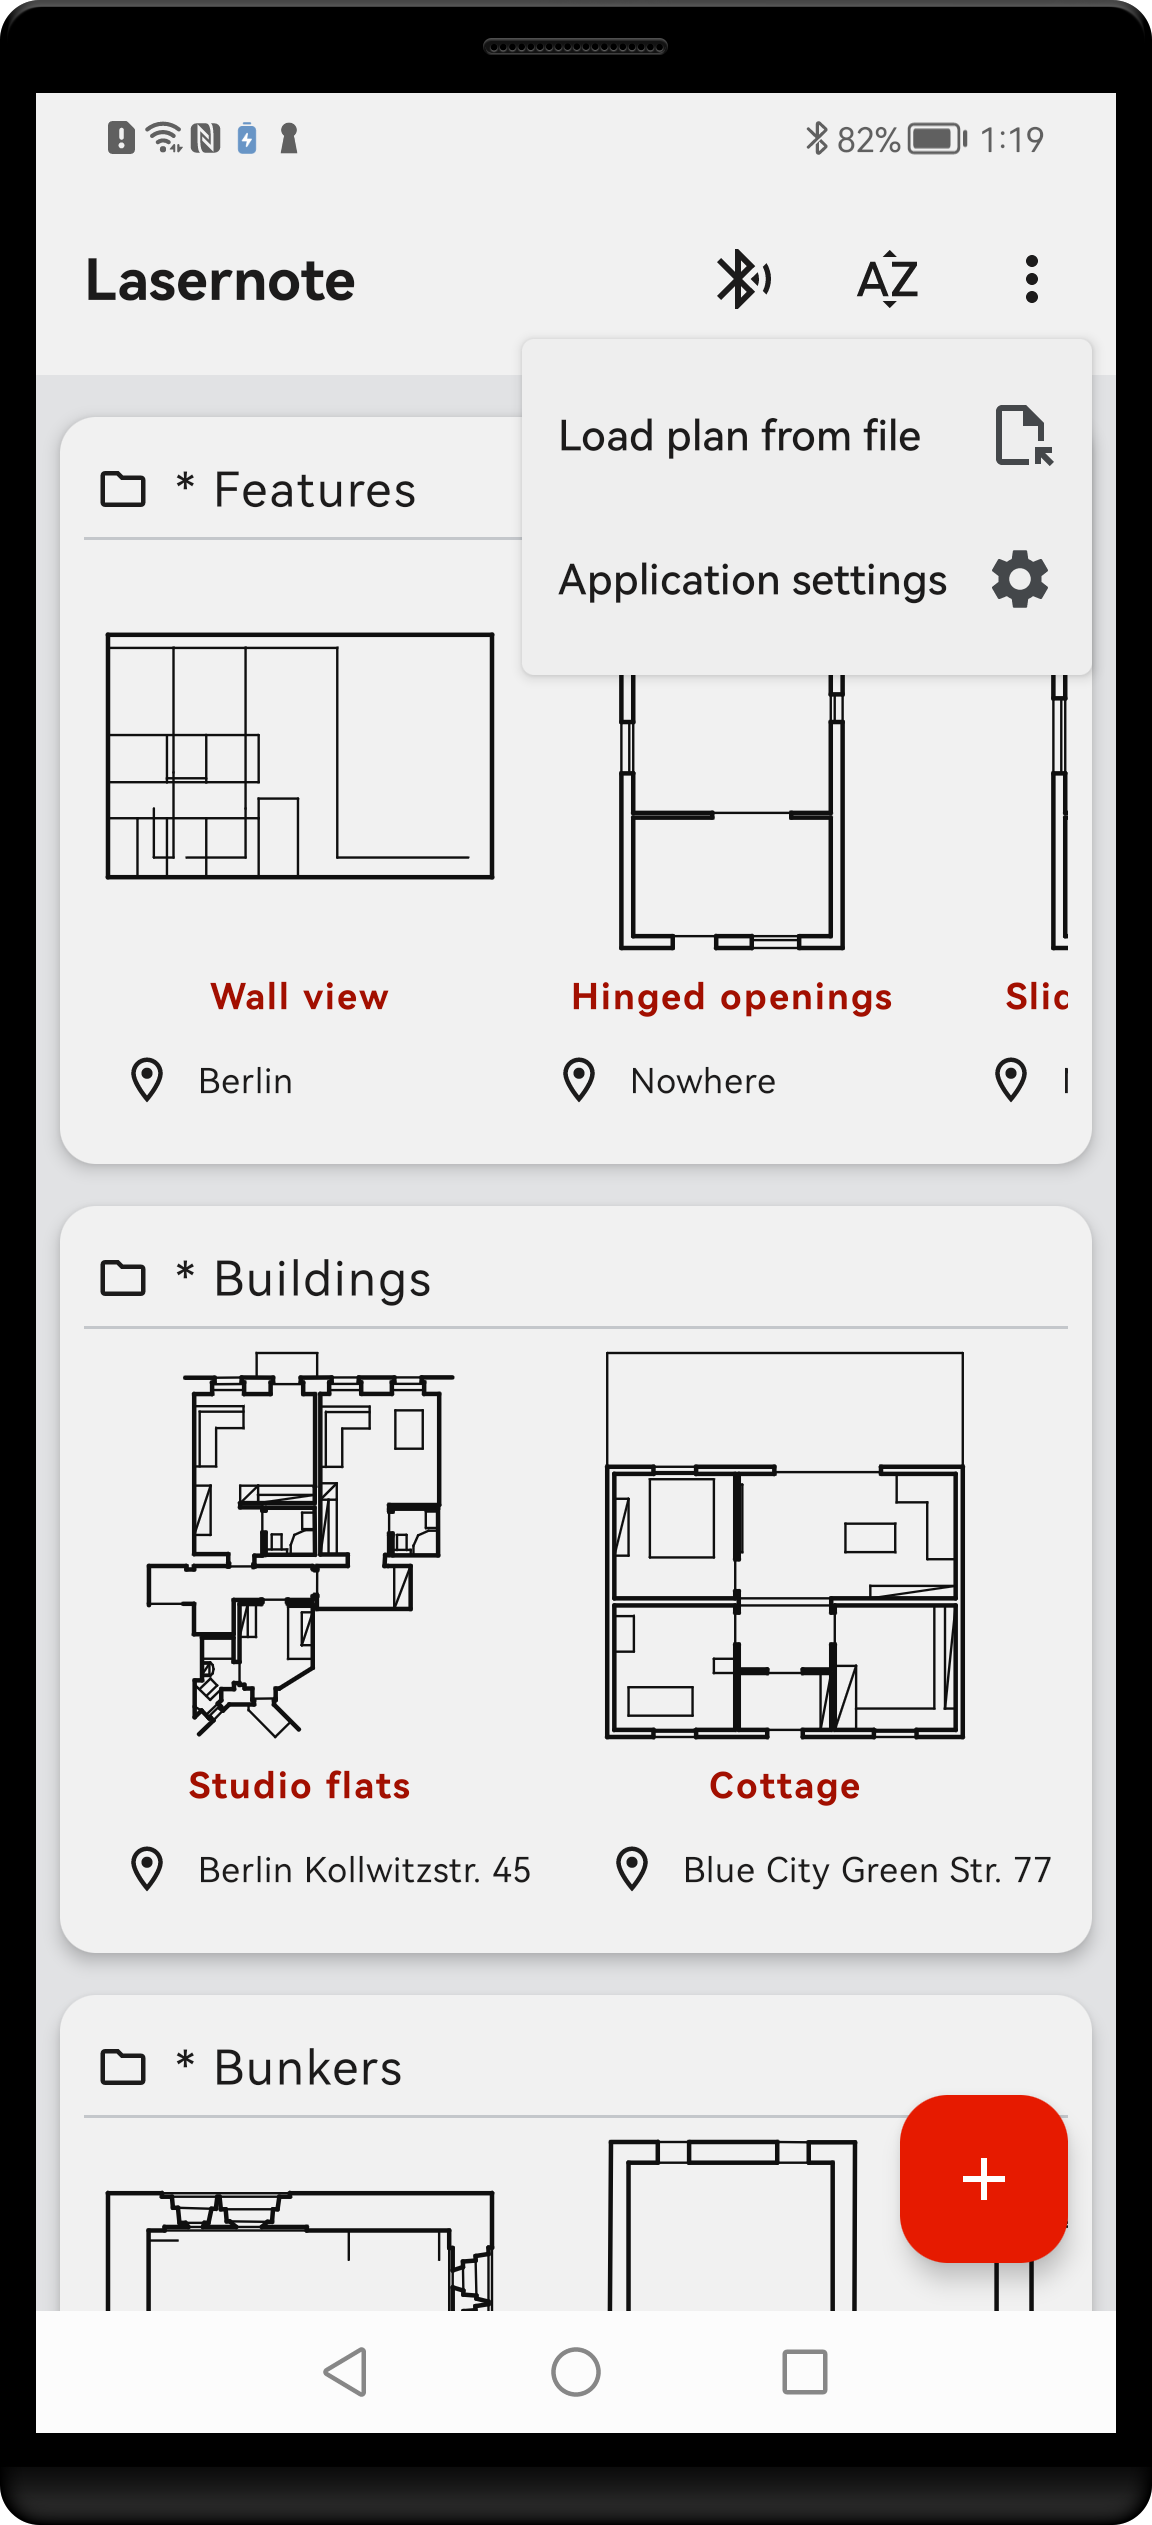
Lasernote main screen, showing plans grouped by project name. Main menu expanded to show all items.
Main screen body displays all plans that are stored in a device memory. Each plan is represented by its name and small preview. It may be accompanied by additional information depending on plans metadata.
Plans can be sorted by following metadata:
- Time last modified
- Site name
- Drawing title
- Project
- Address
Plans are arranged in groups. Grouping method is selected in Application properties screen. Plans can be grouped by following metadata:
- Project
- Town
- Address
- Client name
Tapping on plan opens it in new Plan screen. Long press opens context menu that allows to save selected plan to file or delete it. Please note that the delete is permanent and cannot be undone. On a bottom right of the main screen an action button Add is located. It opens dialogue to create new plan.
Plan screen
Plan screen is accessed after tapping on specific plan box in Main screen.
On the left side of the top bar an Icon button Back is located, navigating back to the Main screen. On the right side following buttons are located:
- Bluetooth – navigate to Bluetooth screen
- Plan properties – navigate to Plan properties screen
- Undo – take back last command
- Redo – repeat undone command
- Export – print plan to file in external format
The body of Plan screen contains area with graphical representation of the selected plan. It can be zoomed and panned for viewing, as well as edited and manipulated.
When needed, additional Measurement bar appears at the bottom of the screen, that allows for editing measurement data.

Plan screen with the measurement bar at the bottom, activated by tapping on a distance label.
Read more in Measure & sketch section.
Image screen
Image screen displays a picture taken previously with the system camera and allows for drawing dimension lines superimposed on the image.
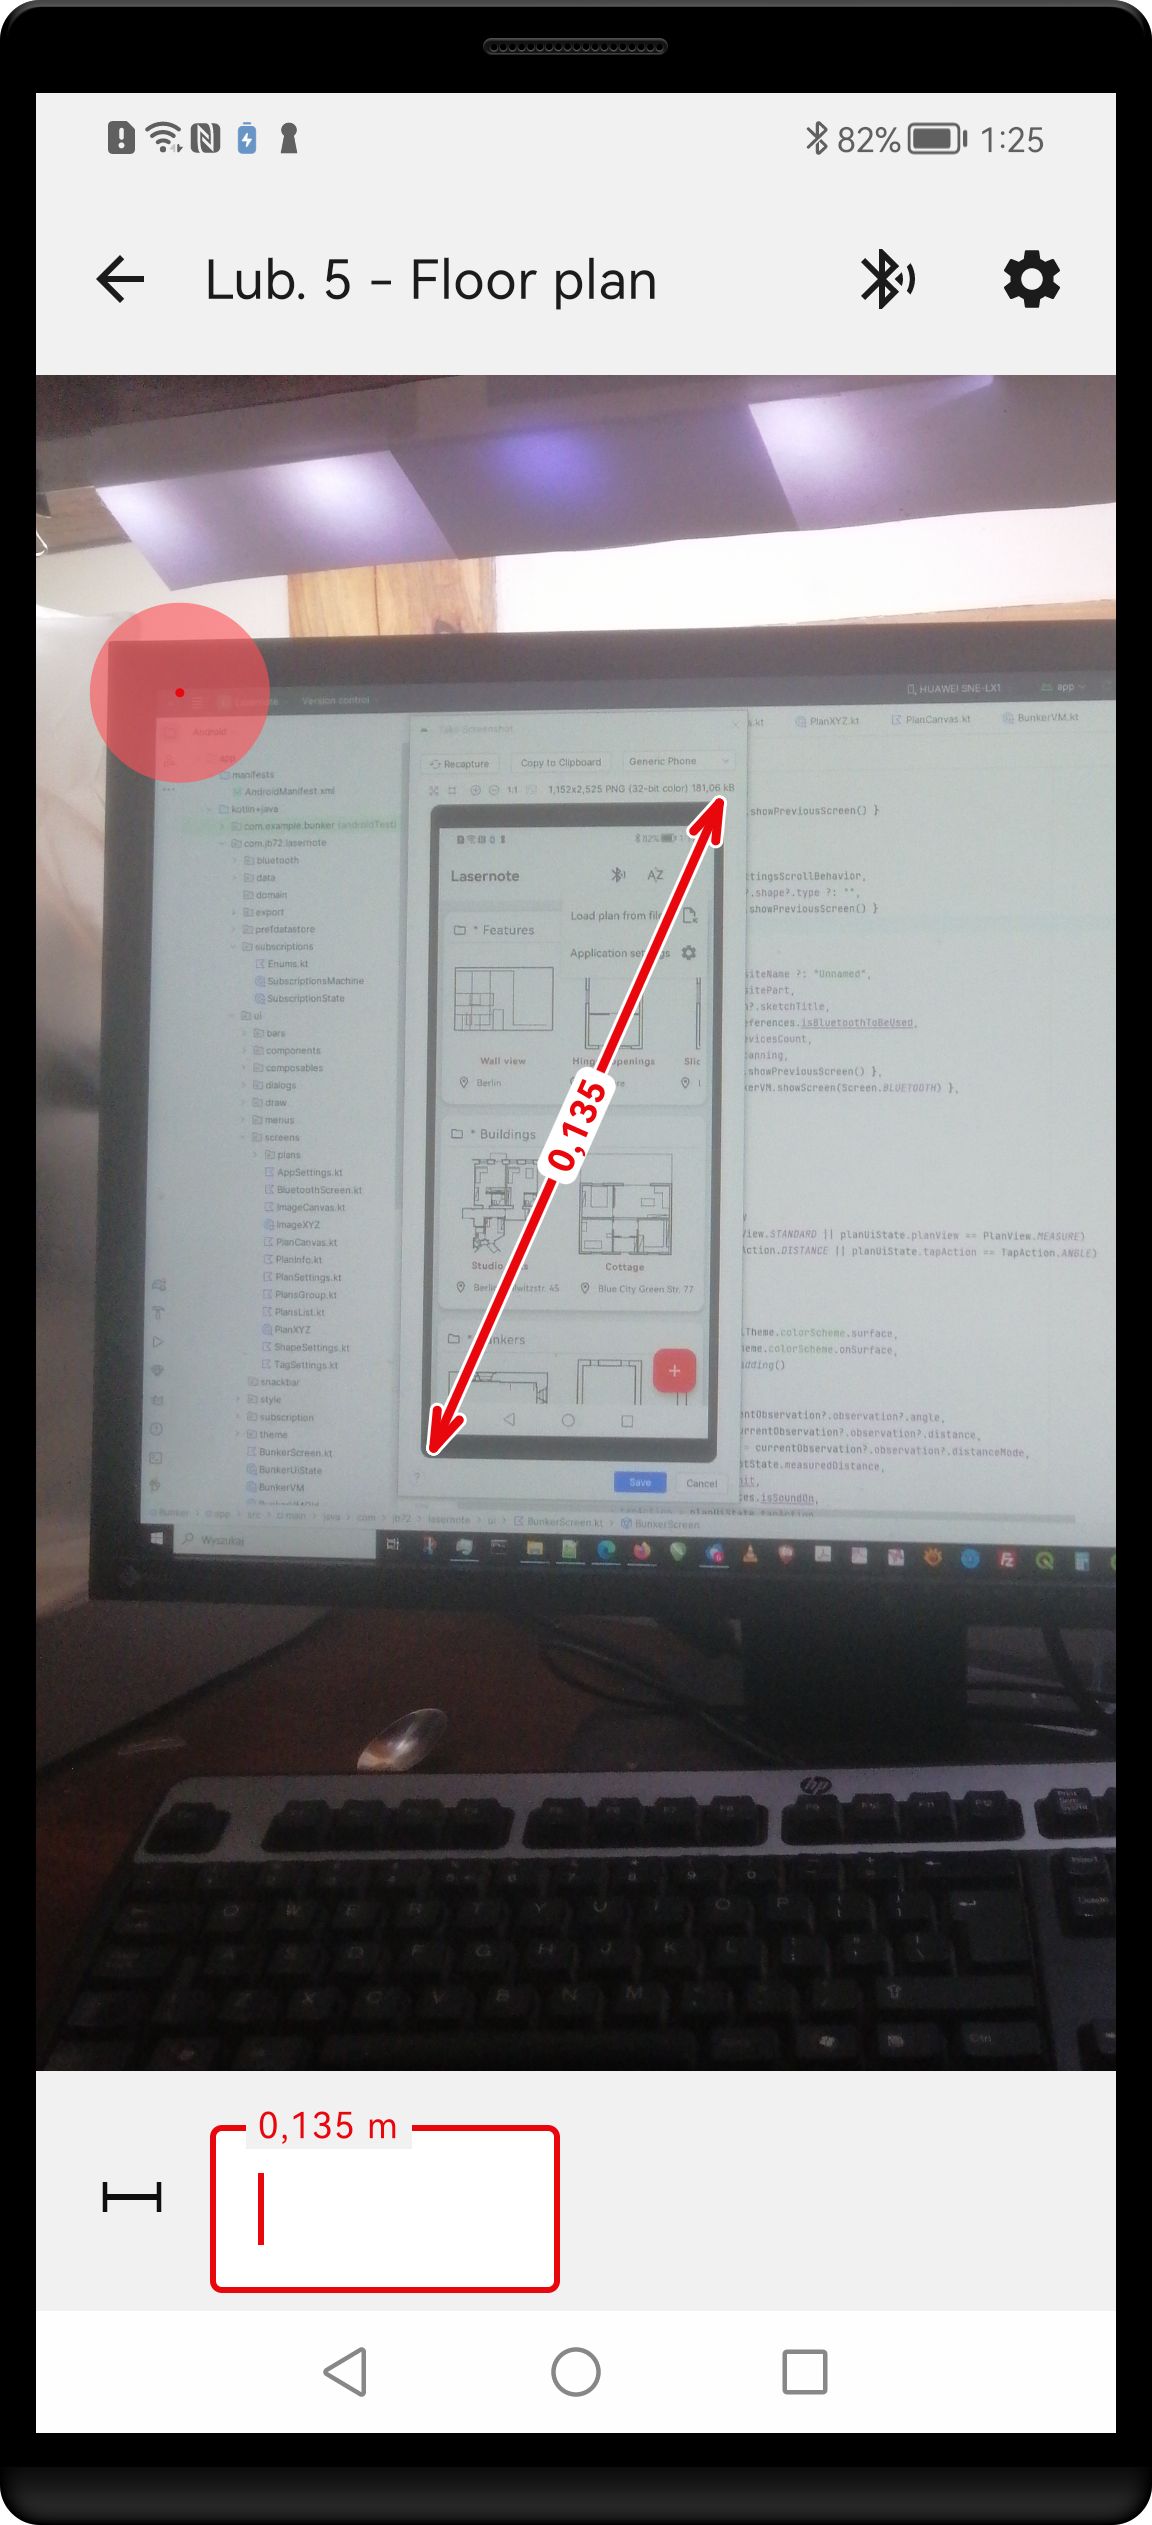
Image screen with the picture displayed together with the added dimension. Measurement bar at the bottom can be activated by tapping on a distance label.
On the left side of the top bar an Icon button Back is located, navigating back to the Plan screen. On the right side following buttons are located:
- Bluetooth – navigate to Bluetooth screen
- Image properties – navigate to Image properties screen
Read more in Measure & sketch section.
Bluetooth screen
Bluetooth screen contains all you need to scan for available laser measures and manage connections to found devices. An icon button Properties on the right side of top bar brings you to your mobile device’s system Bluetooth settings.
Bluetooth screen showing 2 devices currently connected to the application.
Read more in Using Bluetooth section.
Properties’ screens
Properties’ screens are intended for setting properties of plans, shapes, tags as well as of the whole application. Each screen is composed of sets of text fields, drop-down selections and other controls for the input of the settings. Changes are applied in a real time, thus there is no need for saving. Details of individual screens are presented in appropriate sections.
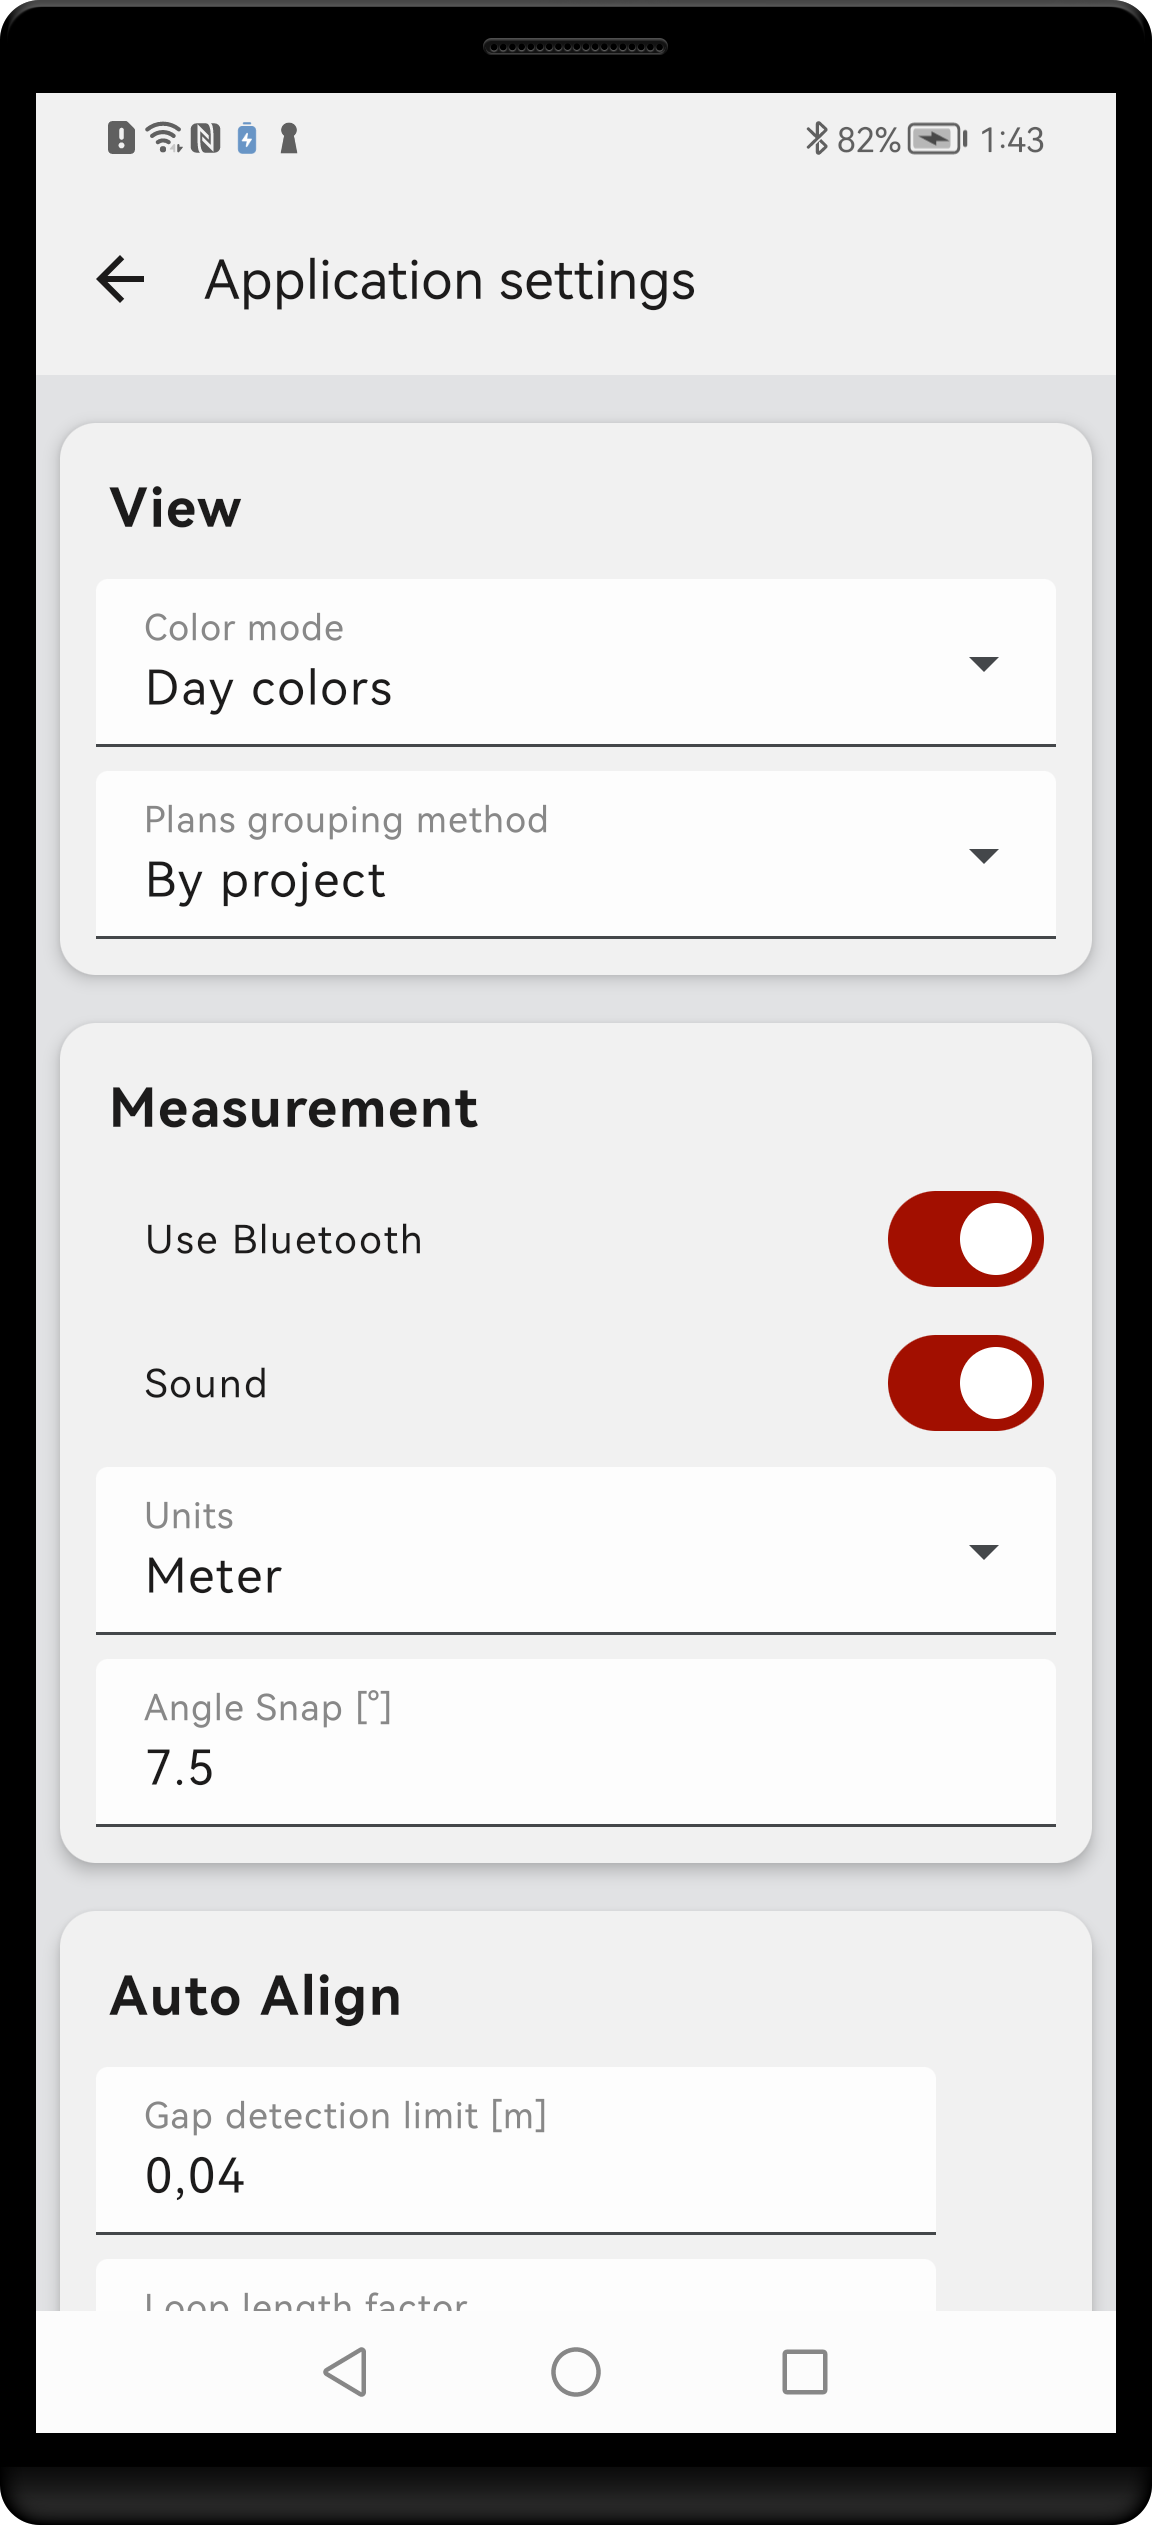
Applications settings screen.
Touch events
To maximise working area in Plan screen, no toolbars are displayed because they would cover the parts of the displayed plan. Instead, the access to various tools and functions is provided by screen touch events, together with the system of context menus. They will be explained individually in next sections, but generally can be classified as follows:
- Tap – dimensions-related functions
- Long press – shape-related functions
- Double tap – view or cursor-related functions
There is no need to learn specific touch events. They are intuitive and you will get familiar with them after a short practice.
Using Bluetooth
Bluetooth setup
1. Lasernote requires that your android device supports Bluetooth version 4.0 or higher (also known as Bluetooth Low Energy). Any modern mobile or tablet should do it. Before you start, make sure, that your laser measure is supported by Lasernote, see Supported devices section. If your laser measure was previously connected or paired with any other device, close this connection and unpair.
2. Switch on laser measure, start Lasernote (in whatever order). In some measure devices Bluetooth needs to be activated by pressing a button. Active Bluetooth is usually indicated by an icon on laser measure’s screen.
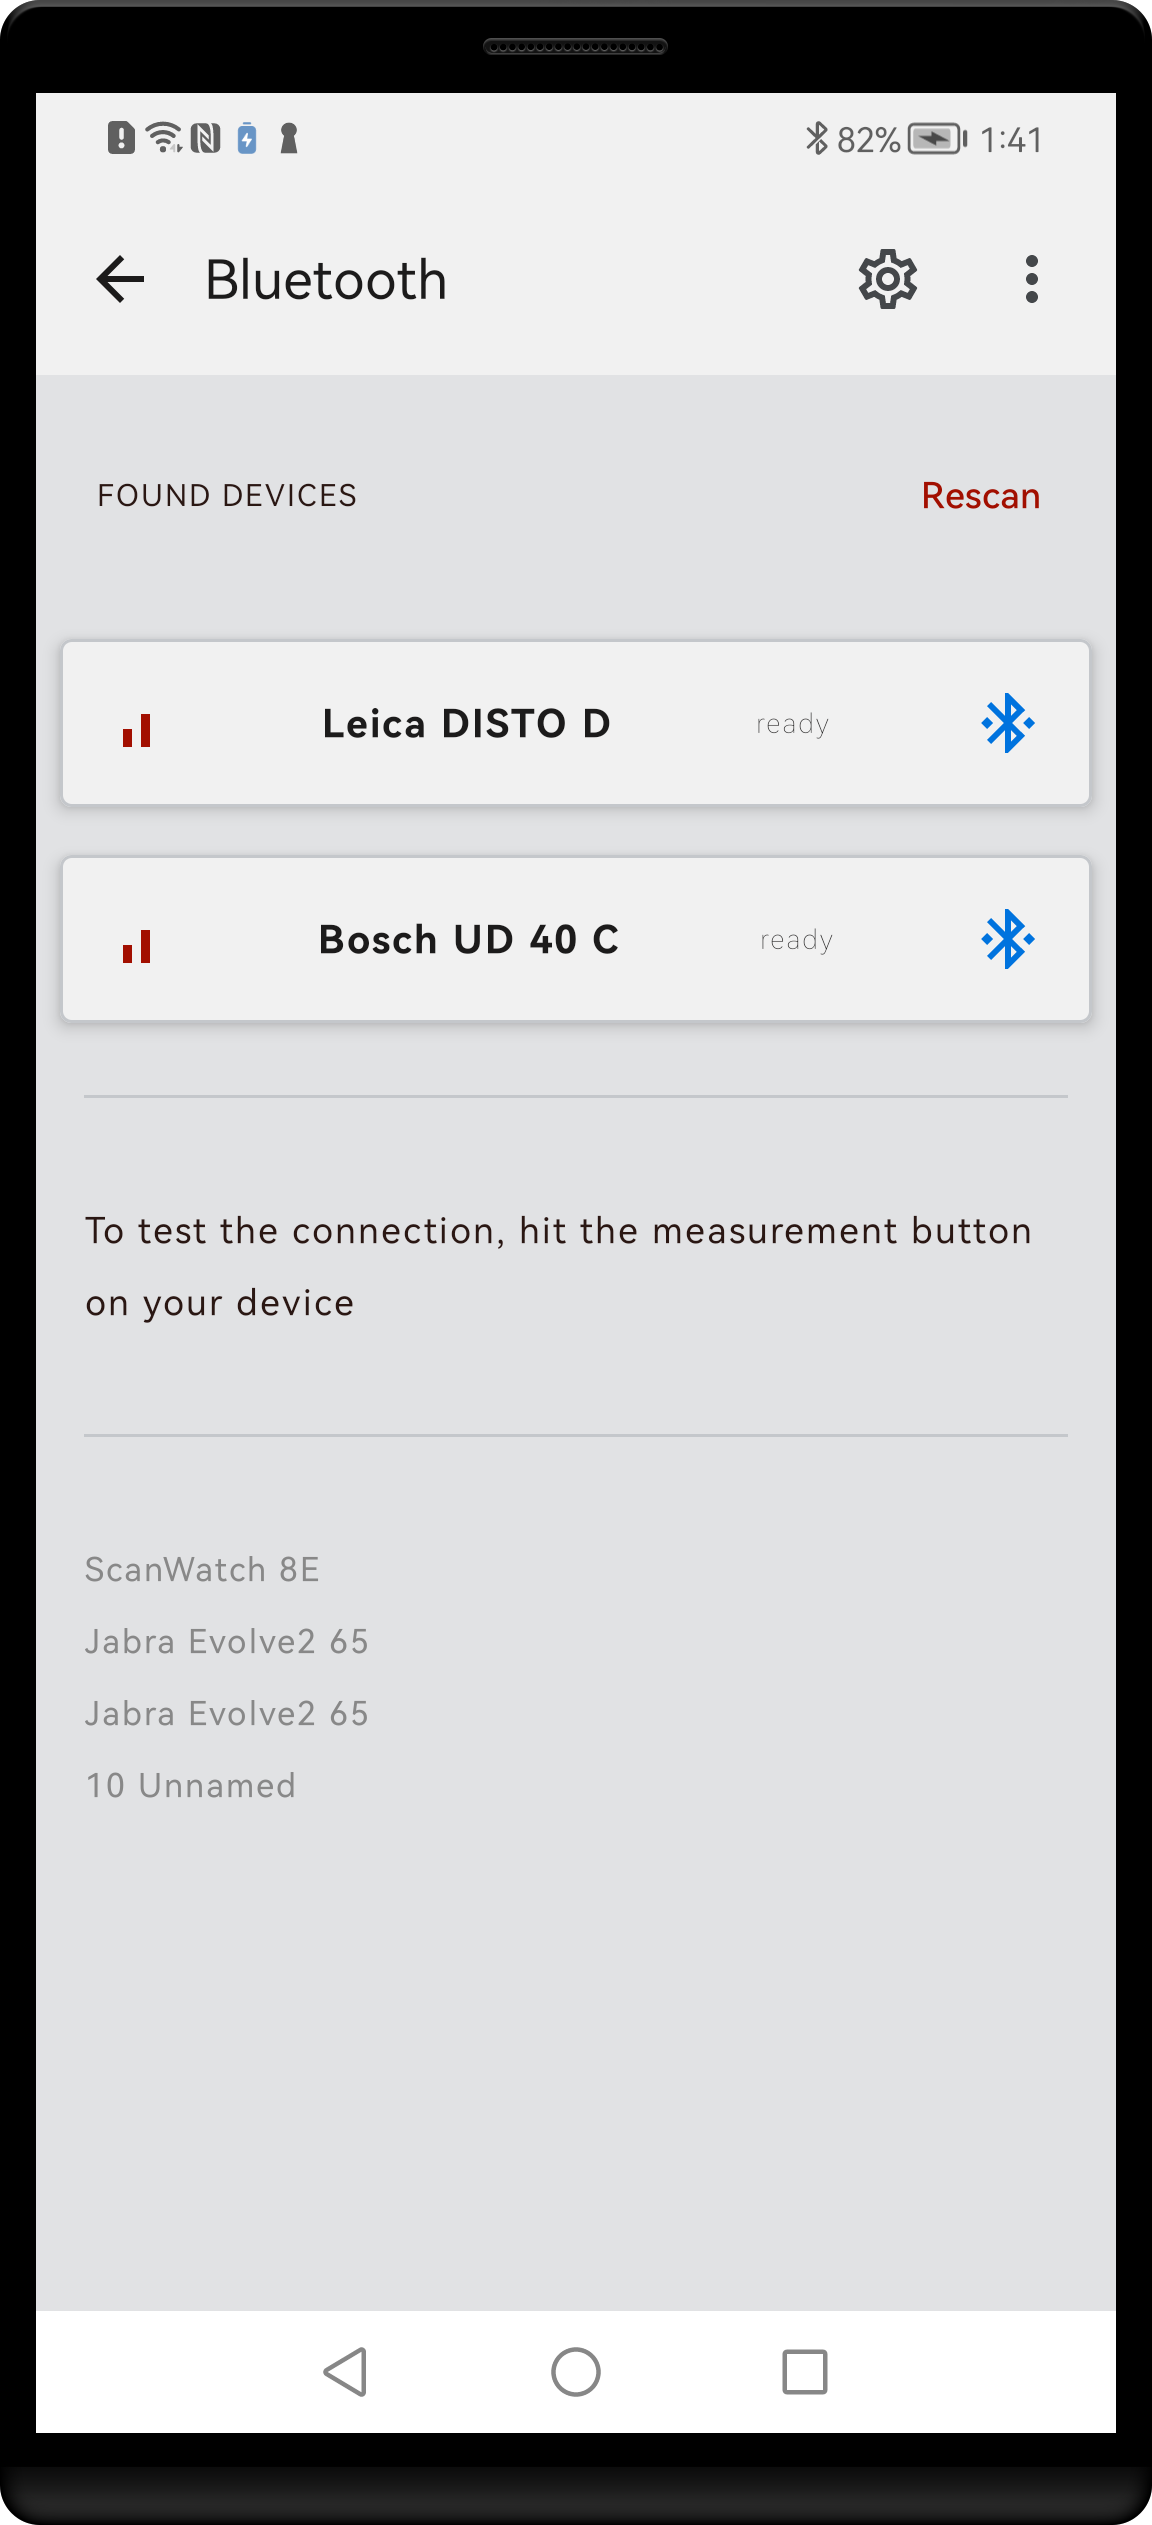
3. Click the Bluetooth icon on the top bar of Main screen. On a first use you will be asked to grant permissions to the app that are necessary to run Bluetooth. If done, app will scan for available devices. Name of your laser measure will show up on the list. Only devices recognised as laser measure are listed, other Bluetooth devices like headsets or smartwatches are filtered out.
4. Each list item is composed of signal strength indicator icon, device name and connection status icon. Connection between laser measure and your mobile device will be initiated automatically. Once connection is established, the Bluetooth icon on the right turns blue.
Bluetooth screen showing 2 devices currently connected to the application.
5. Lasernote will remember last used device and try to restore the connection after it was lost for some reasons, for example after next launch of application. However, scanning for Bluetooth devices does not take place all the time – it would eat your battery too quickly. Lasernote tries to guess when do you really need laser measure and scans in background at those moments. If for some reasons Bluetooth icon does not turn blue, you can still connect manually (points 3-4).
Troubleshooting
Large variety of devices, operating systems and communication protocols may lead to an unexpected behaviour in some cases. The most common causes of problems with Bluetooth connection are:
- laser measure is not supported – check list of supported devices in Supported devices section
- laser measure is paired with another android device – make sure it is not, disconnect and unpair if needed
- in case of Leica X series - device must be paired with your mobile, but not connected. On a first pairing it will probably try to connect automatically as a keybord. If so, go to your mobile Bluetooth settings and disconnect it (but leave it paired). It should be enough to do it once on startup
- Bluetooth connection is not activated in laser measure – some devices do not automatically switch on Bluetooth on startup and require manual action using dedicated button or via software menu. Check manual of the laser measure
- permissions are not granted – application will ask for user permissions in order to be able to scan for Bluetooth devices and connect to them. Note that on some systems you will be asked for Location permission. This is requirement of Google to allow for Bluetooth LE connections. Apart from permissions, location service must be switched on in in your mobile’s preferences. Lasernote itself does not use any location data
- Bluetooth is off in the mobile device – normally application will check it and ask if needed
- low battery in laser measure – some devices are known to lower signal strength in low battery conditions
- In some cases it may be needed to restart services. There are various levels of reset:
- restart Bluetooth service using Reset command from Bluetooth screen menu
- restart the mobile/tablet and laser measure
- clear Bluetooth cache of the mobile device. Consult the appropriate manual for directions
Measure & sketch
Create new plan
In Main screen, tap an action button Add. You will be shown a dialogue window with text field, prompting to give the new plan a name. It should be a phrase that best identifies your object. If possible, it should be unique across plans. Try to keep the names short but informative. You can change the name later in Plan properties.
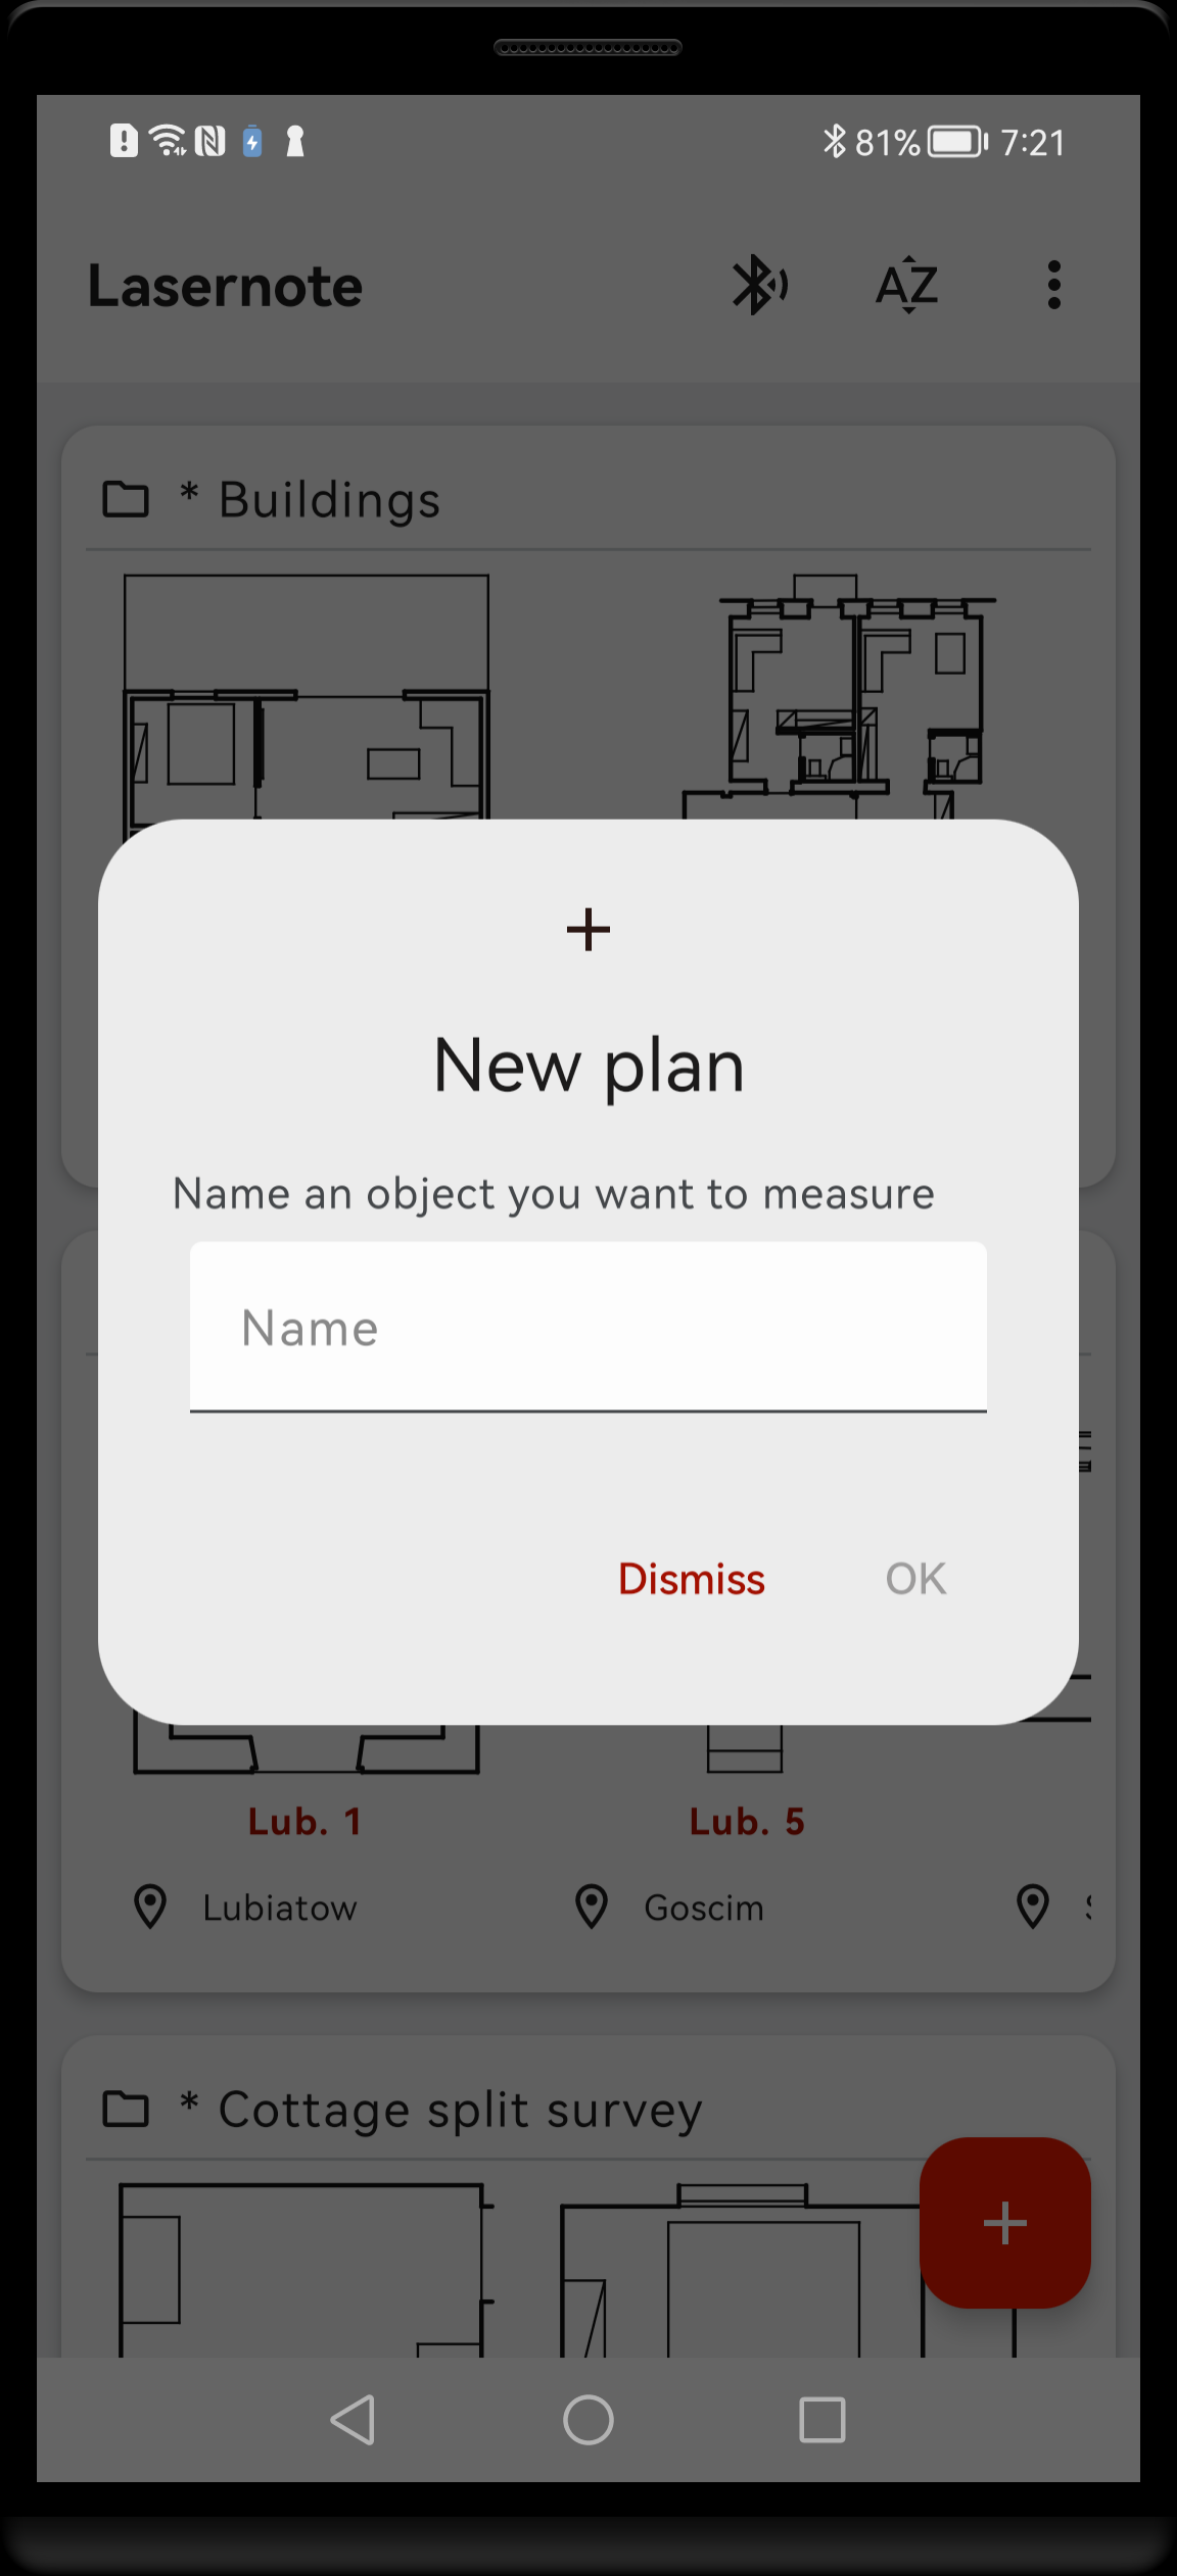
New plan dialogue. Fill the text field with the name phrase and tap “OK”. Ideally the name should be unique, informative and short.
Plan properties
In general, plan metadata are meant to provide means to classify and identify each plan, and to bring an order in your plans’ collection. However, there are so many different job scenarios and workflows, that it is not realistic to provide a single classification scheme that will fit each use case equally well. Therefore, you should not treat the here presented hints very strictly as some other approach might fit your needs better. With time, you should develop your own way of using Plan properties. Metadata are grouped in several categories.
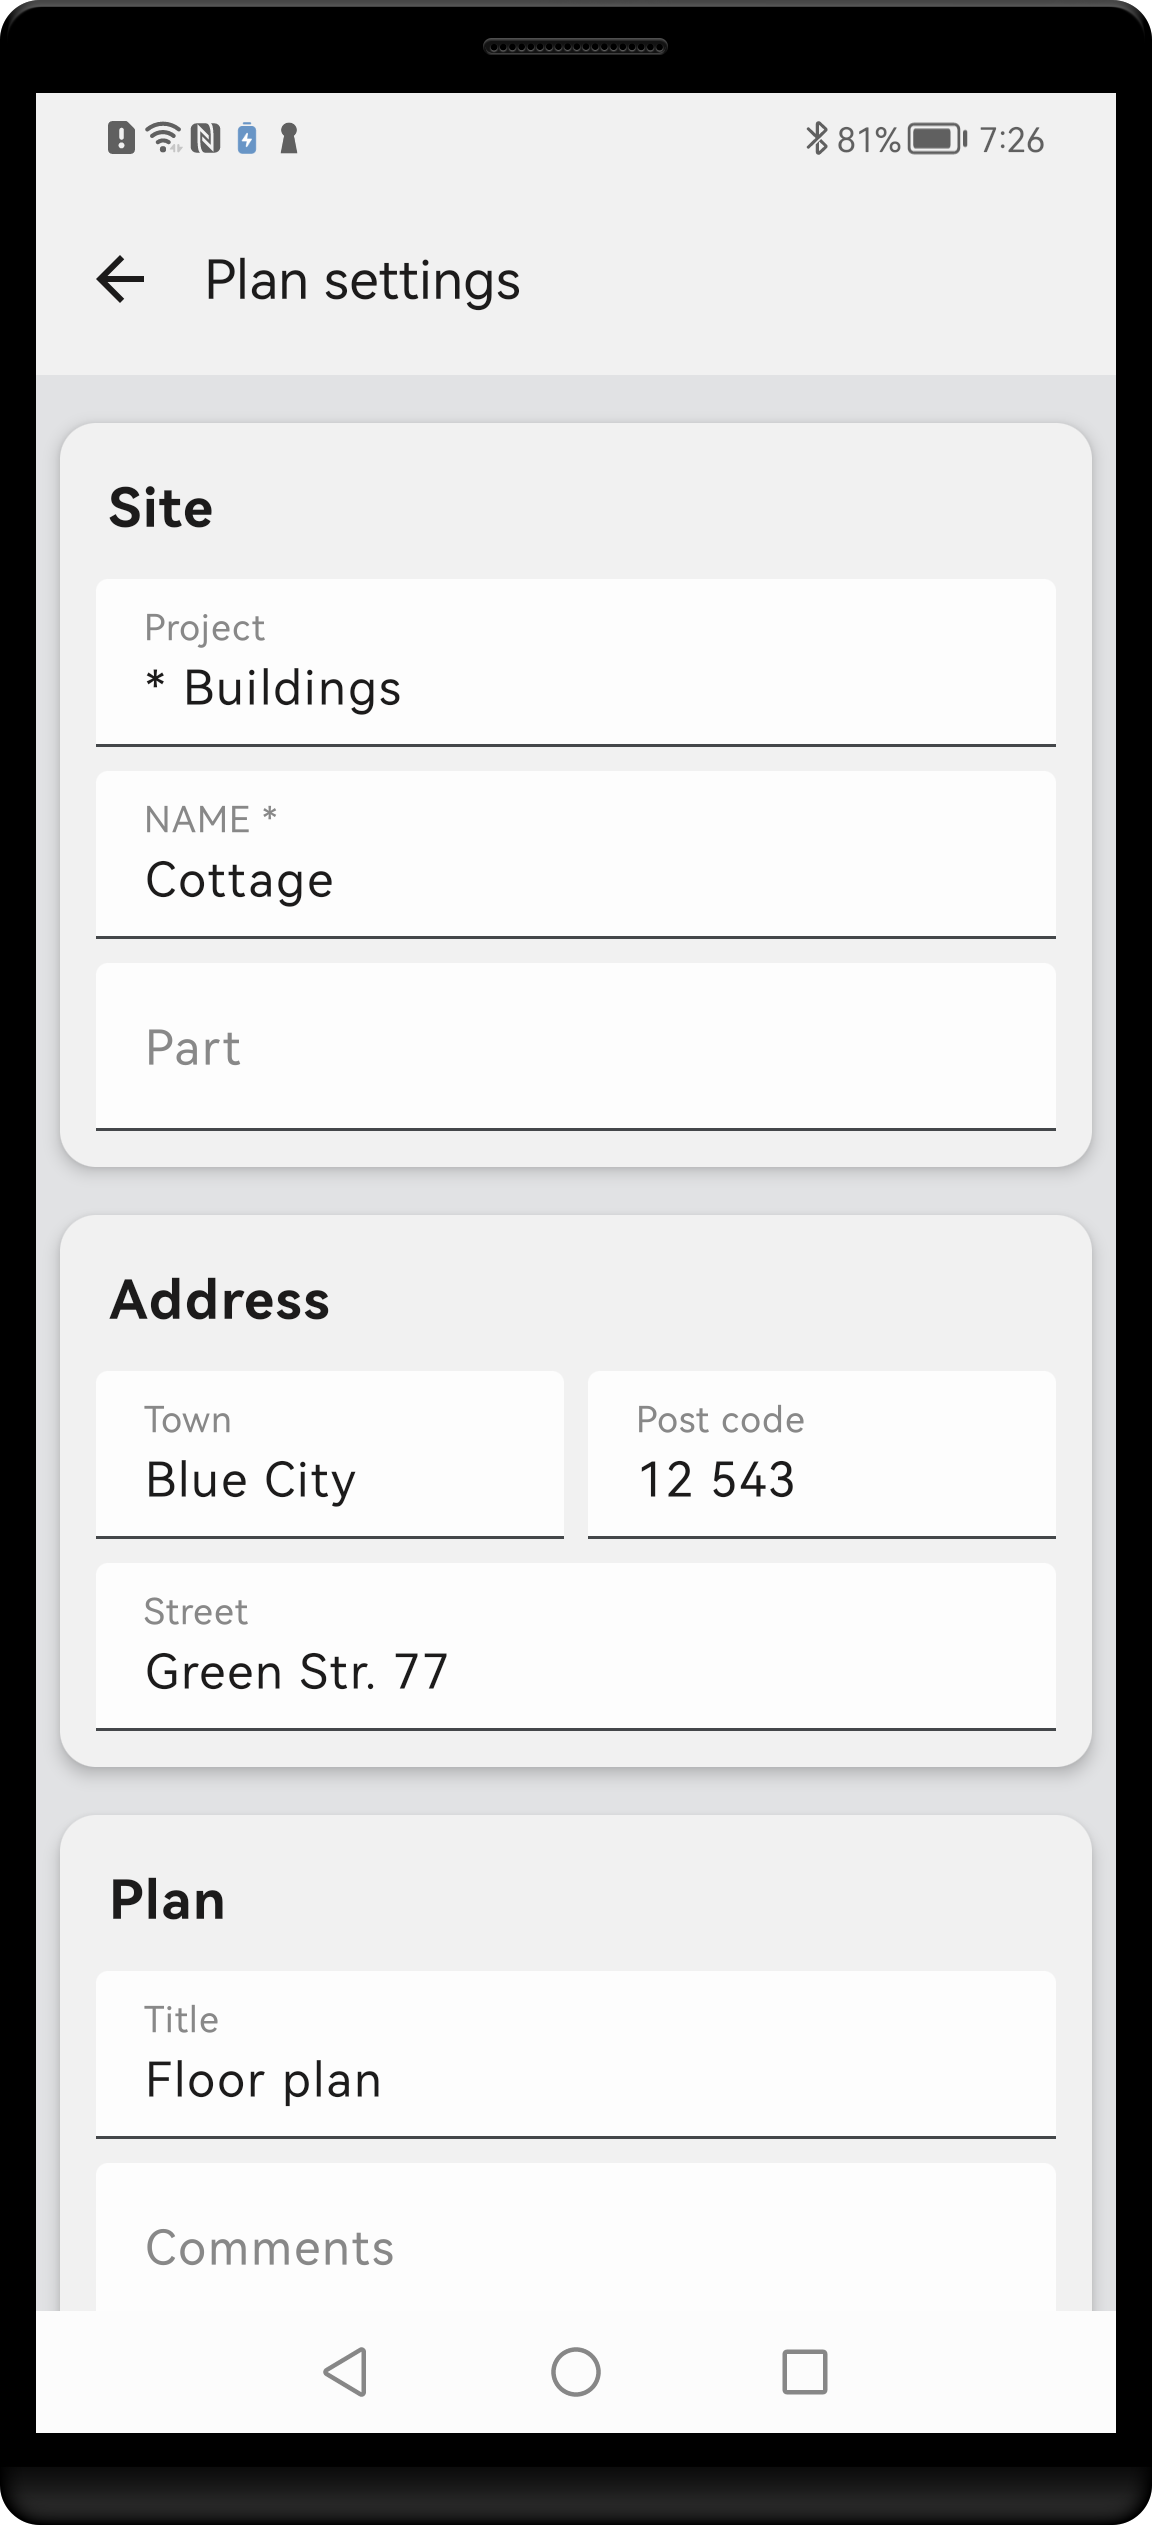
Plan settings screen. Only the NAME field is mandatory. However, it is recommended to fill as many fields as needed to completely describe the plan.
Site
These fields should describe the site and object you measure.
- Project – if your object belongs to a wider complex or there is any other reason to group it with other plans, use this field
- Name – a phrase that best identifies your object. If possible, it should be unique. Try to keep the names short but informative. This field is mandatory
- Part – if your object is split into several parts, each having a separate sketch, make them share a common name and distinguish them using this field
Address
Describe location of the object.
- Town – city or village name
- Post code – post code if applicable
- Street – street address with number; if not applicable it could be parcel number
Plan
Information related to plan as a sketch.
- Title – e.g. “Facade view” or “Foundation plan”
- Comments – any comment of interest, e.g. building condition (multiline)
- Notes – “private” comments that you want to keep for yourself (multiline)
Client
The person or company that contracted the job.
- Name – person or company name.
- Other information – address data, affiliation, position etc. (multiline)
Conduct measurement
Technically, each measurement is a pair of distance and angle values, together with three points that organise them in space (start point, angle reference point and resulting end point). Lasernote user creates and manipulates measurements without taking care about this technical representation. Measurement is conducted simply by drawing on the screen.
New measurement
At any moment, measurement start point is indicated by a Measurement cursor, a red circle attached to some point. To add new measurement, simply drag the Measurement cursor on the screen in the desired direction and a new line will be created. By default, the Measurement cursor is located at the end of last measurement. If you want to start at some other point, just double tap on this point and the cursor will move to the new start position.
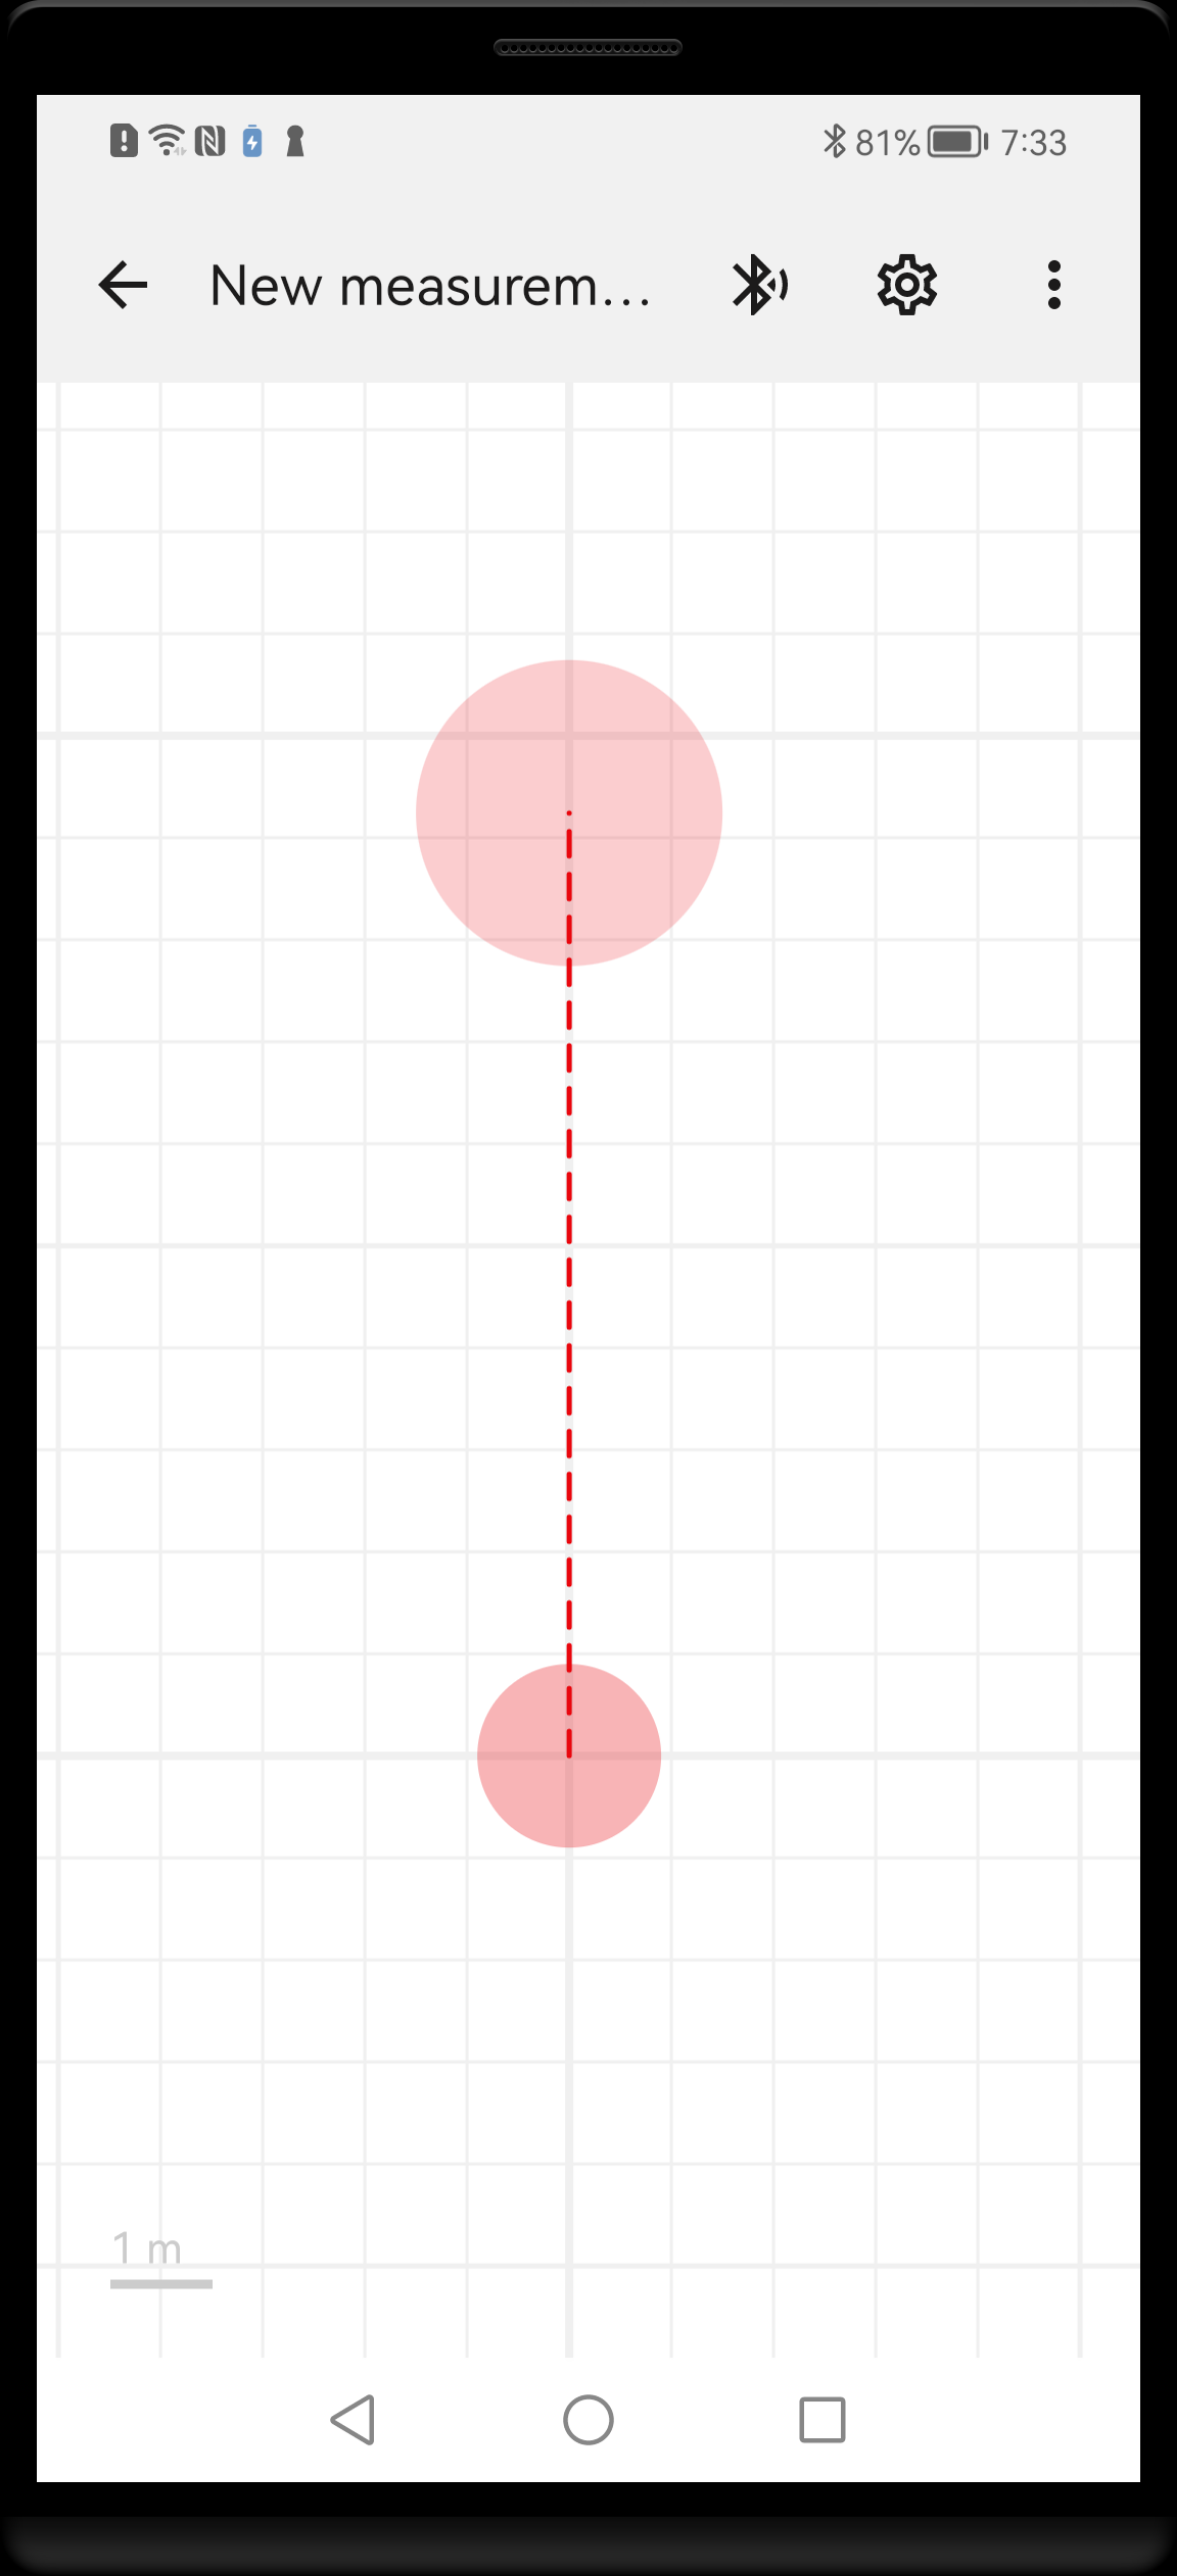
While dragging the Measurement cursor, temporary dashed line is drawn to indicate the new measurement direction and distance.
While you draw, created lines are snapped to X-Y grid so they become strictly vertical or horizontal. This is what you need in most cases. Default snapping range is +- 7.5 degrees, you can change it in Application properties. If the angle deviates from straight direction by more than this value, it will be accepted as you have drawn it. Once new angle is present, an additional sloping grid is added to snapping behaviour, so you can draw lines at angles that are straight to the new line. The X-Y snapping grid is still active, so you can easily return to it.
Set distance and angle
To set the measured values, a Measurement bar is displayed at the bottom of the screen. After drawing new measurement line, the bar displays an initial distance value based on line length on the screen. Now you can enter a new value by taking a measurement with your connected laser measure. The drawing will get updated to the new distance value. Alternatively, you can enter new value by hand, using keyboard.
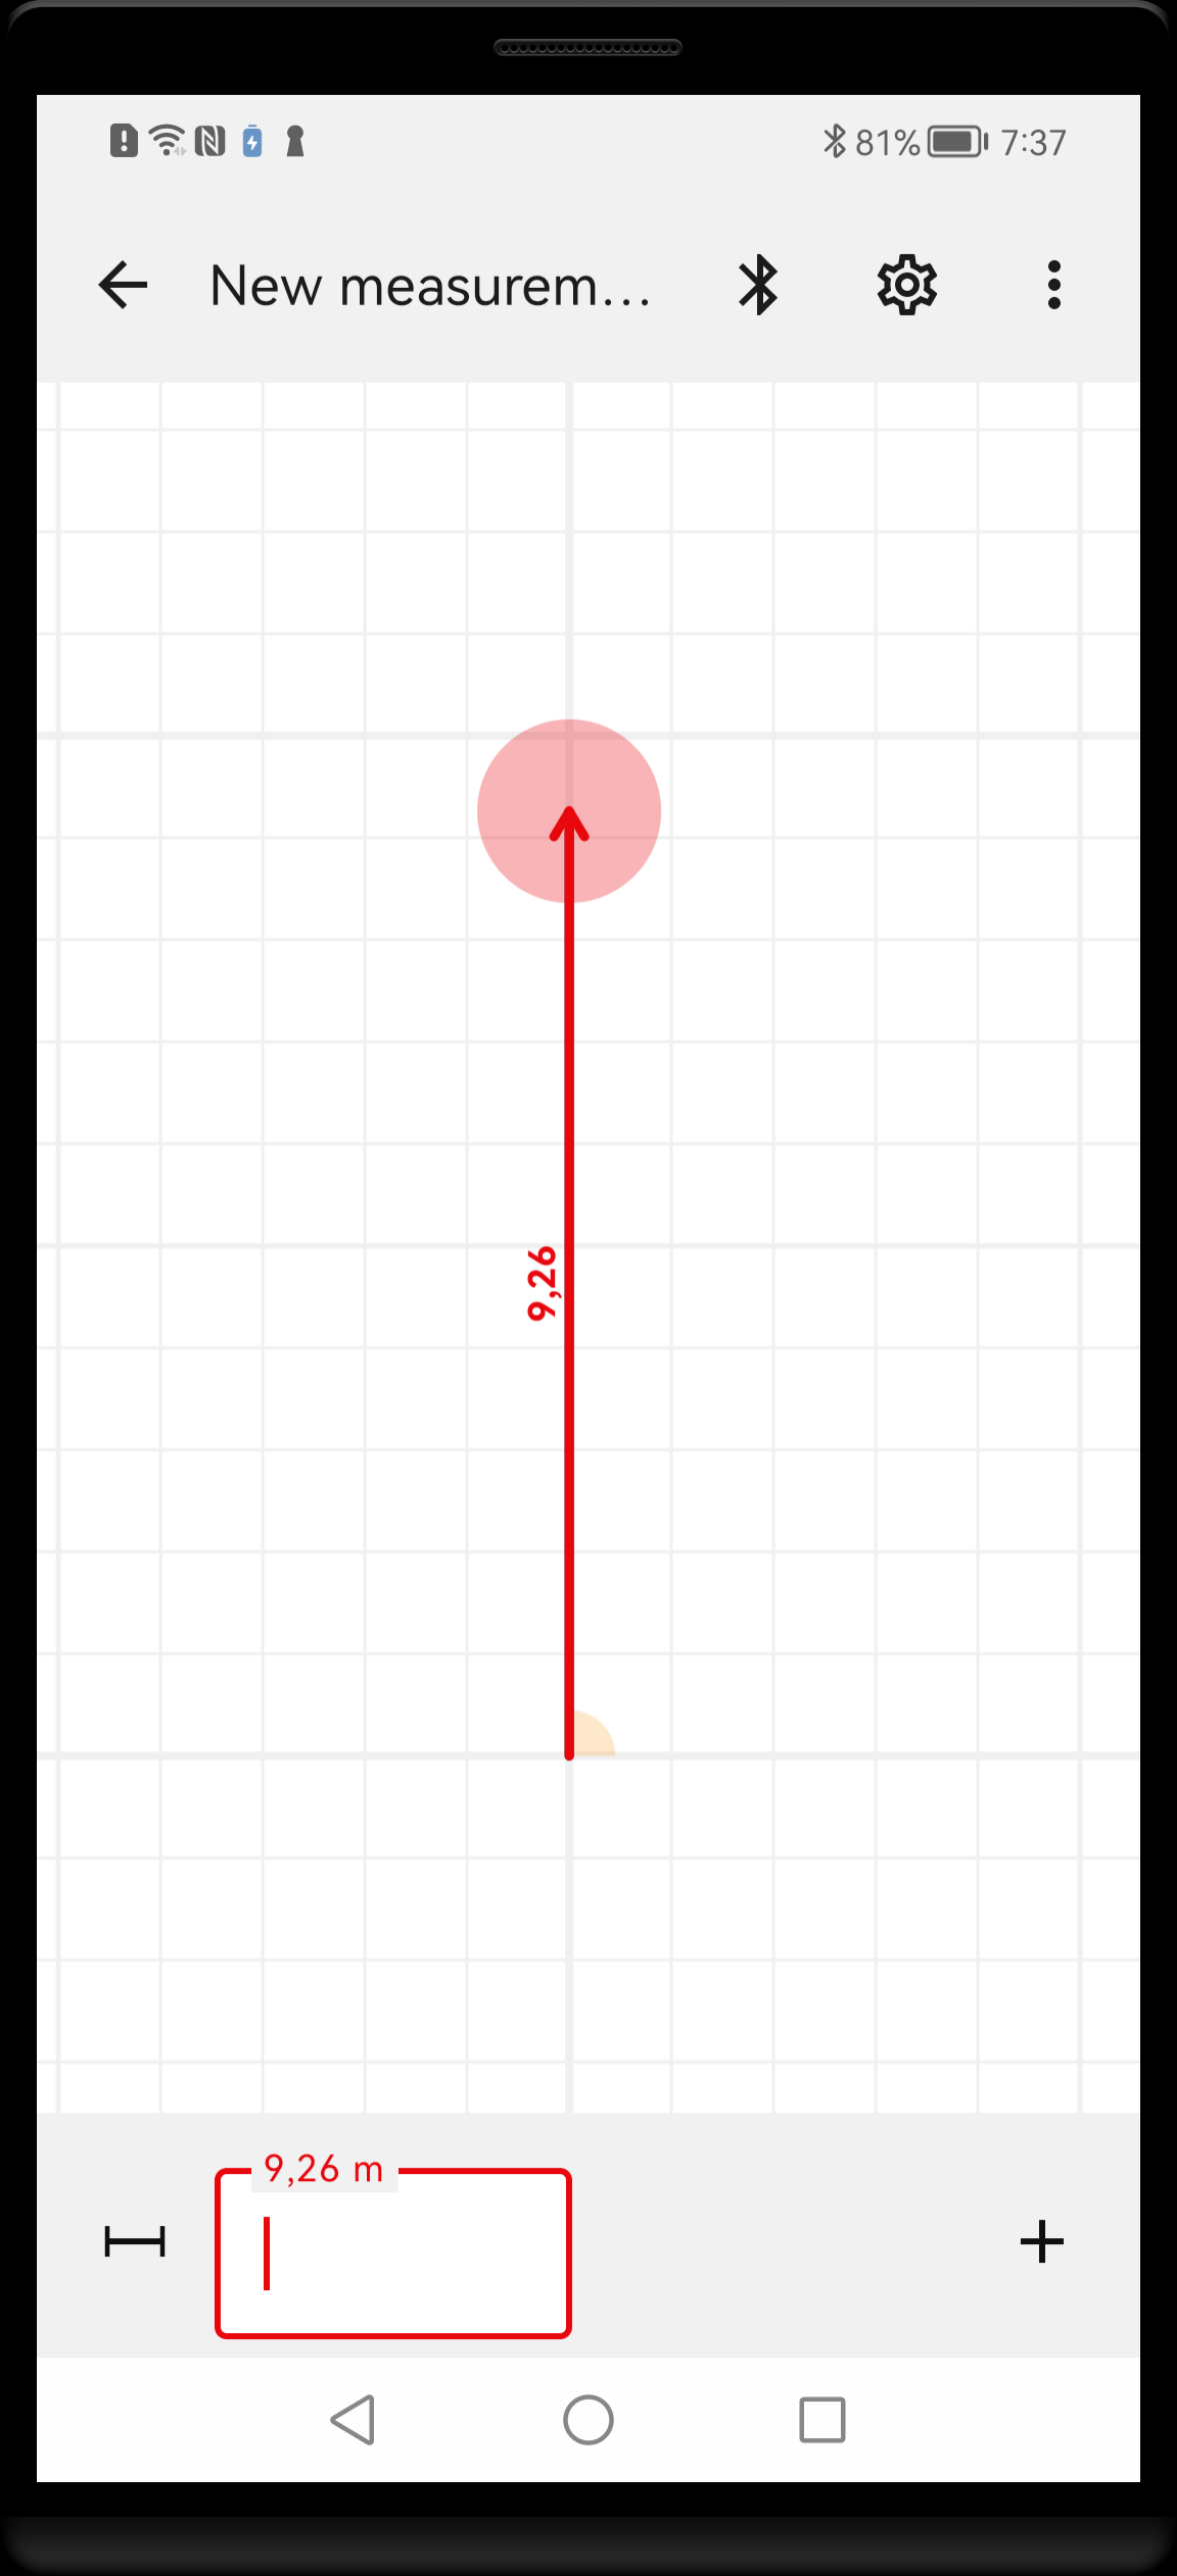
The measurement bar appears at the bottom of the screen after drawing a new line or after tapping on the distance label. The text field allows for entering the measured distance either from laser measure or by typing the number on a keyboard.
To edit values in existing measurement, the same Measurement bar will show up upon tapping on a distance value displayed along each line. Similarly, you can edit value of selected angle by tapping on angle value or on an angle arc. Please note that values of straight angles are hidden for clarity.
The use of Measurement bar is straightforward. The outlined Input field is used to enter a new value of distance or angle. If you input the value from keyboard, hit Enter to accept new value. The | Type icons on the left side of the Input field indicate whether the value is distance or angle. Tapping on this icon will toggle between distance and angle of the same observation. The Add icon on the right side of Measurement bar is for series measurements. Read about series measurements below.
Series measurements
In a real survey it is often necessary to take several measurements along a single line, for example to draw window openings in a wall. The preferred method in such case is to take series measurement.
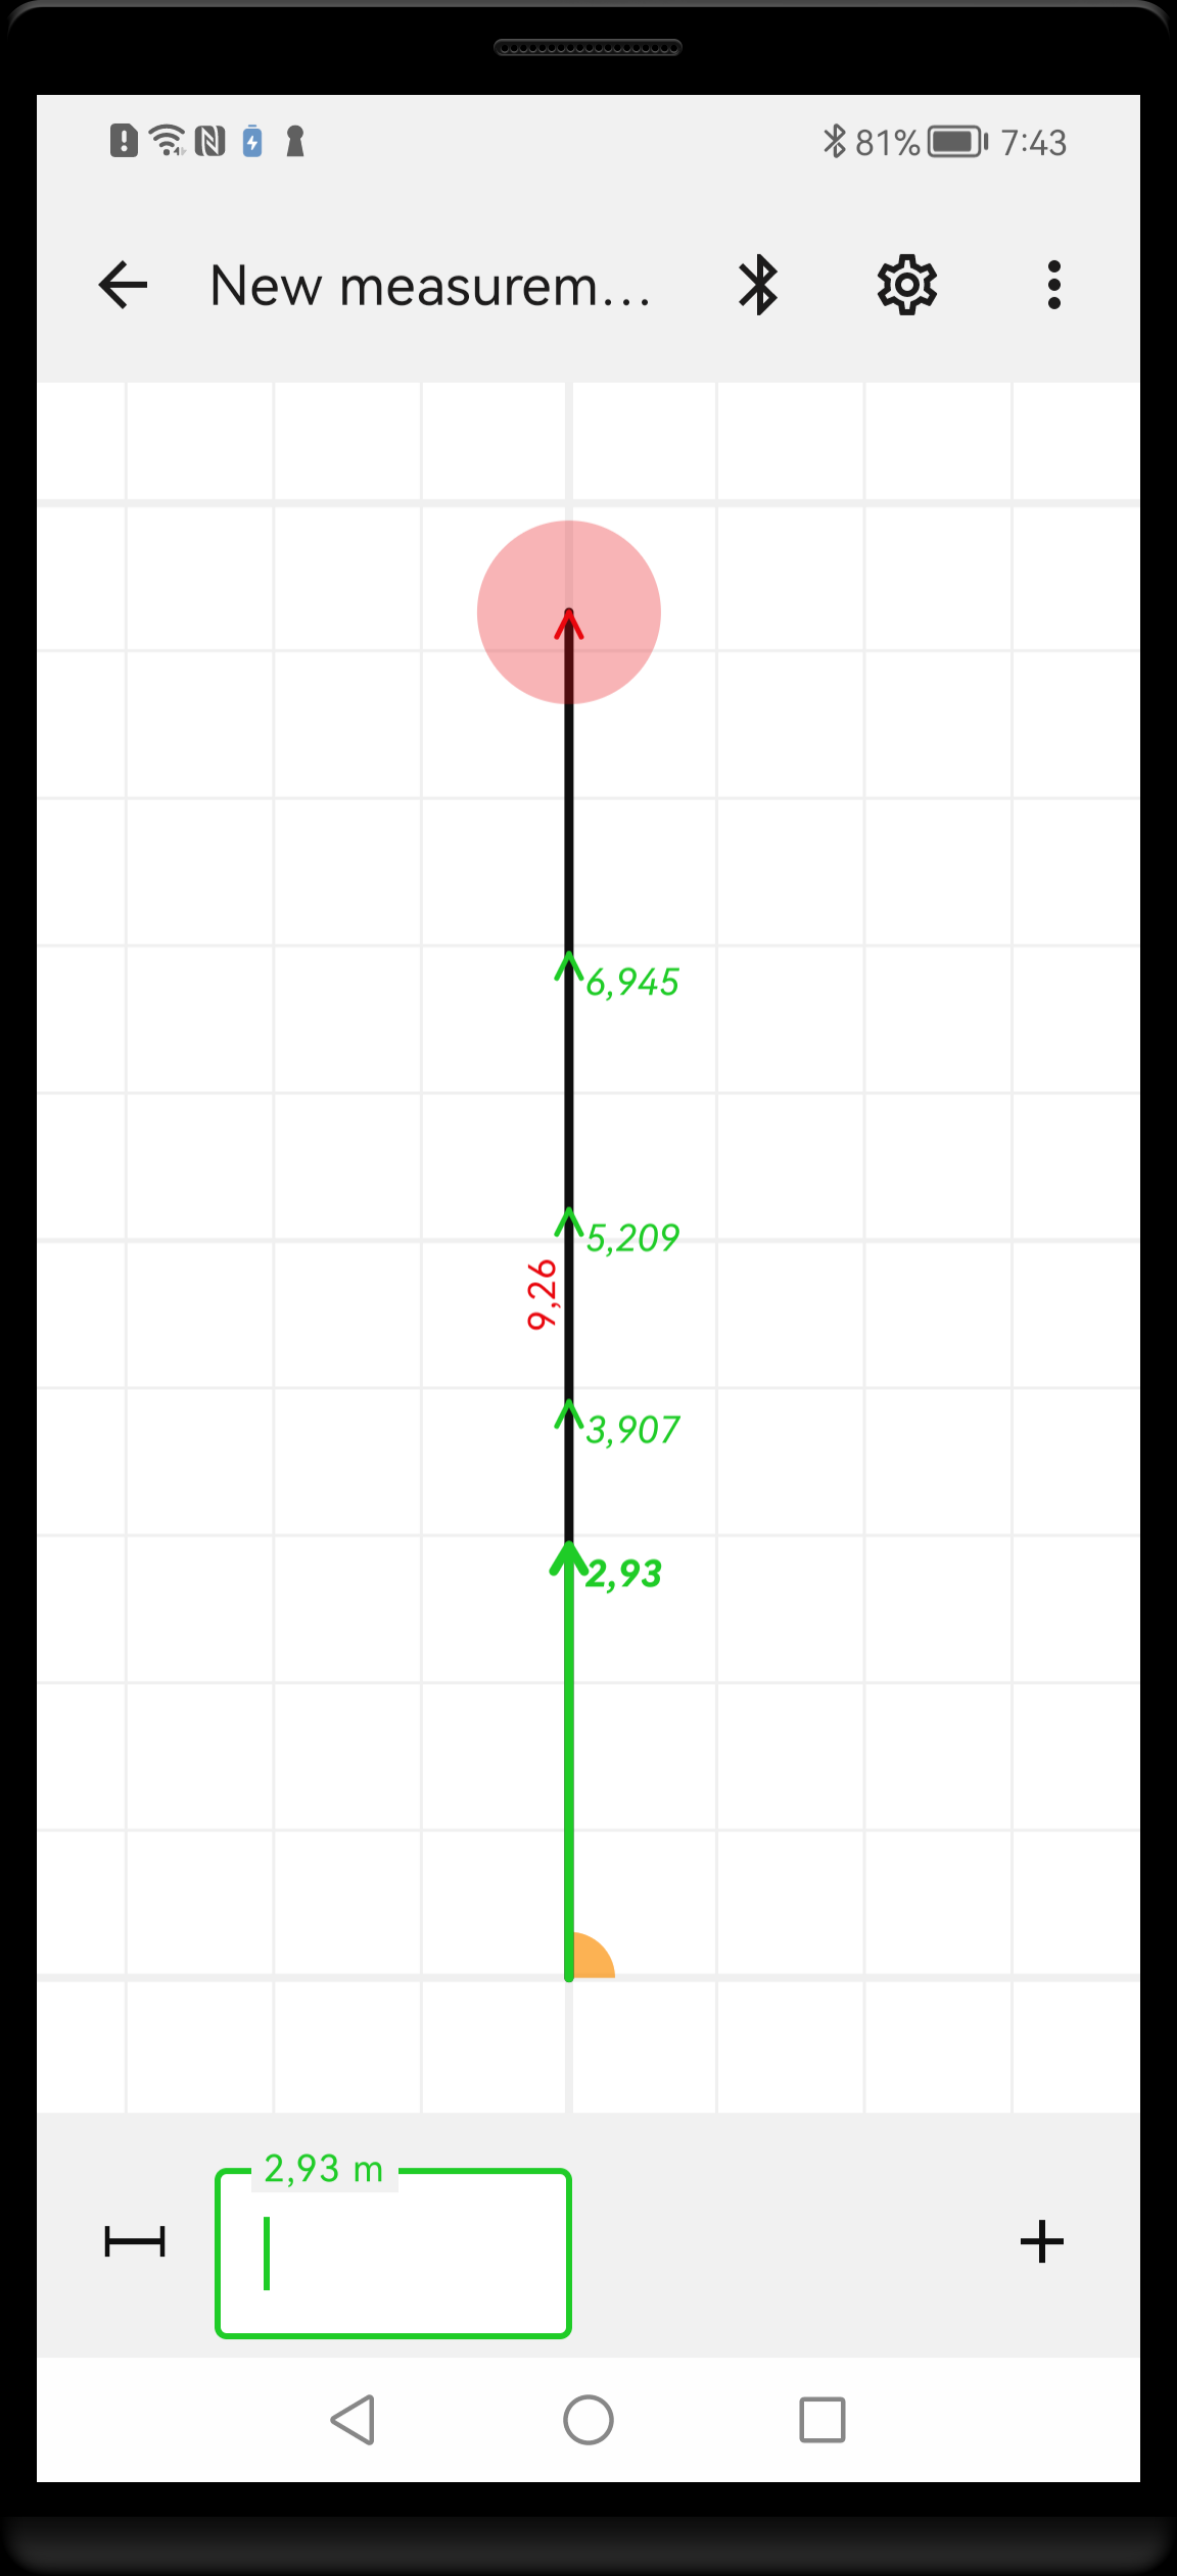
Series is a group of measurements taken from one point in the same direction. Such measurements will always form a line. The longest, outer measurement is coloured red and labelled parallel to the line. The shorter, inner measurements are coloured green and labelled perpendicular to the line.
The term series measurement stands for a collection of measurements that start from the same point and are made at the same angle. As a consequence, the end points of these measurements are collinear. Lasernote automatically recognises such a group and creates series internally. The longest distance in a series is displayed in a standard way, with a length label coloured red and placed along the line. The shorter, inner distances are coloured green and the labels are placed perpendicular to the line, at the end of each section.
To create a new series or to add a distance to the existing series, tap on any distance label that belongs to the line of interest. The Measurement bar will be displayed. Tap on the Add button on the right. New distance will be created at the same angle, with some default starting value. You will set the desired value in a usual way, using laser measure or typing by hand.
Delete measurement
Deleting measurements is more problematic than it may seem. In most cases it is simply not possible because the measurement is used (directly or indirectly) as a start or reference for some other measurements. Therefore, it is only possible to delete “free” measurements located at the ends of measurement chains. Moreover, deleting is somehow against the application idea, which is thought to store a record of surveying process on site.
However, if you have a really good reason to do it, you can delete the measurement by setting its distance value to 0 (zero). If the measurement is unused, it will be deleted together with all the shapes attached to the measurement end point. Delete will occur without further warning.
Draw the shapes
Shapes are graphical elements built on the scaffold of measurement points. Two types of shapes are available:
- Shape points – located at the selected measurement points
- Shape lines – spanned between pairs of selected measurement points
The shapes are strictly attached to measurement points. If measurements are edited, the attached shapes will be affected by the resulting changes. If measurements were deleted, the attached shapes will be deleted too.
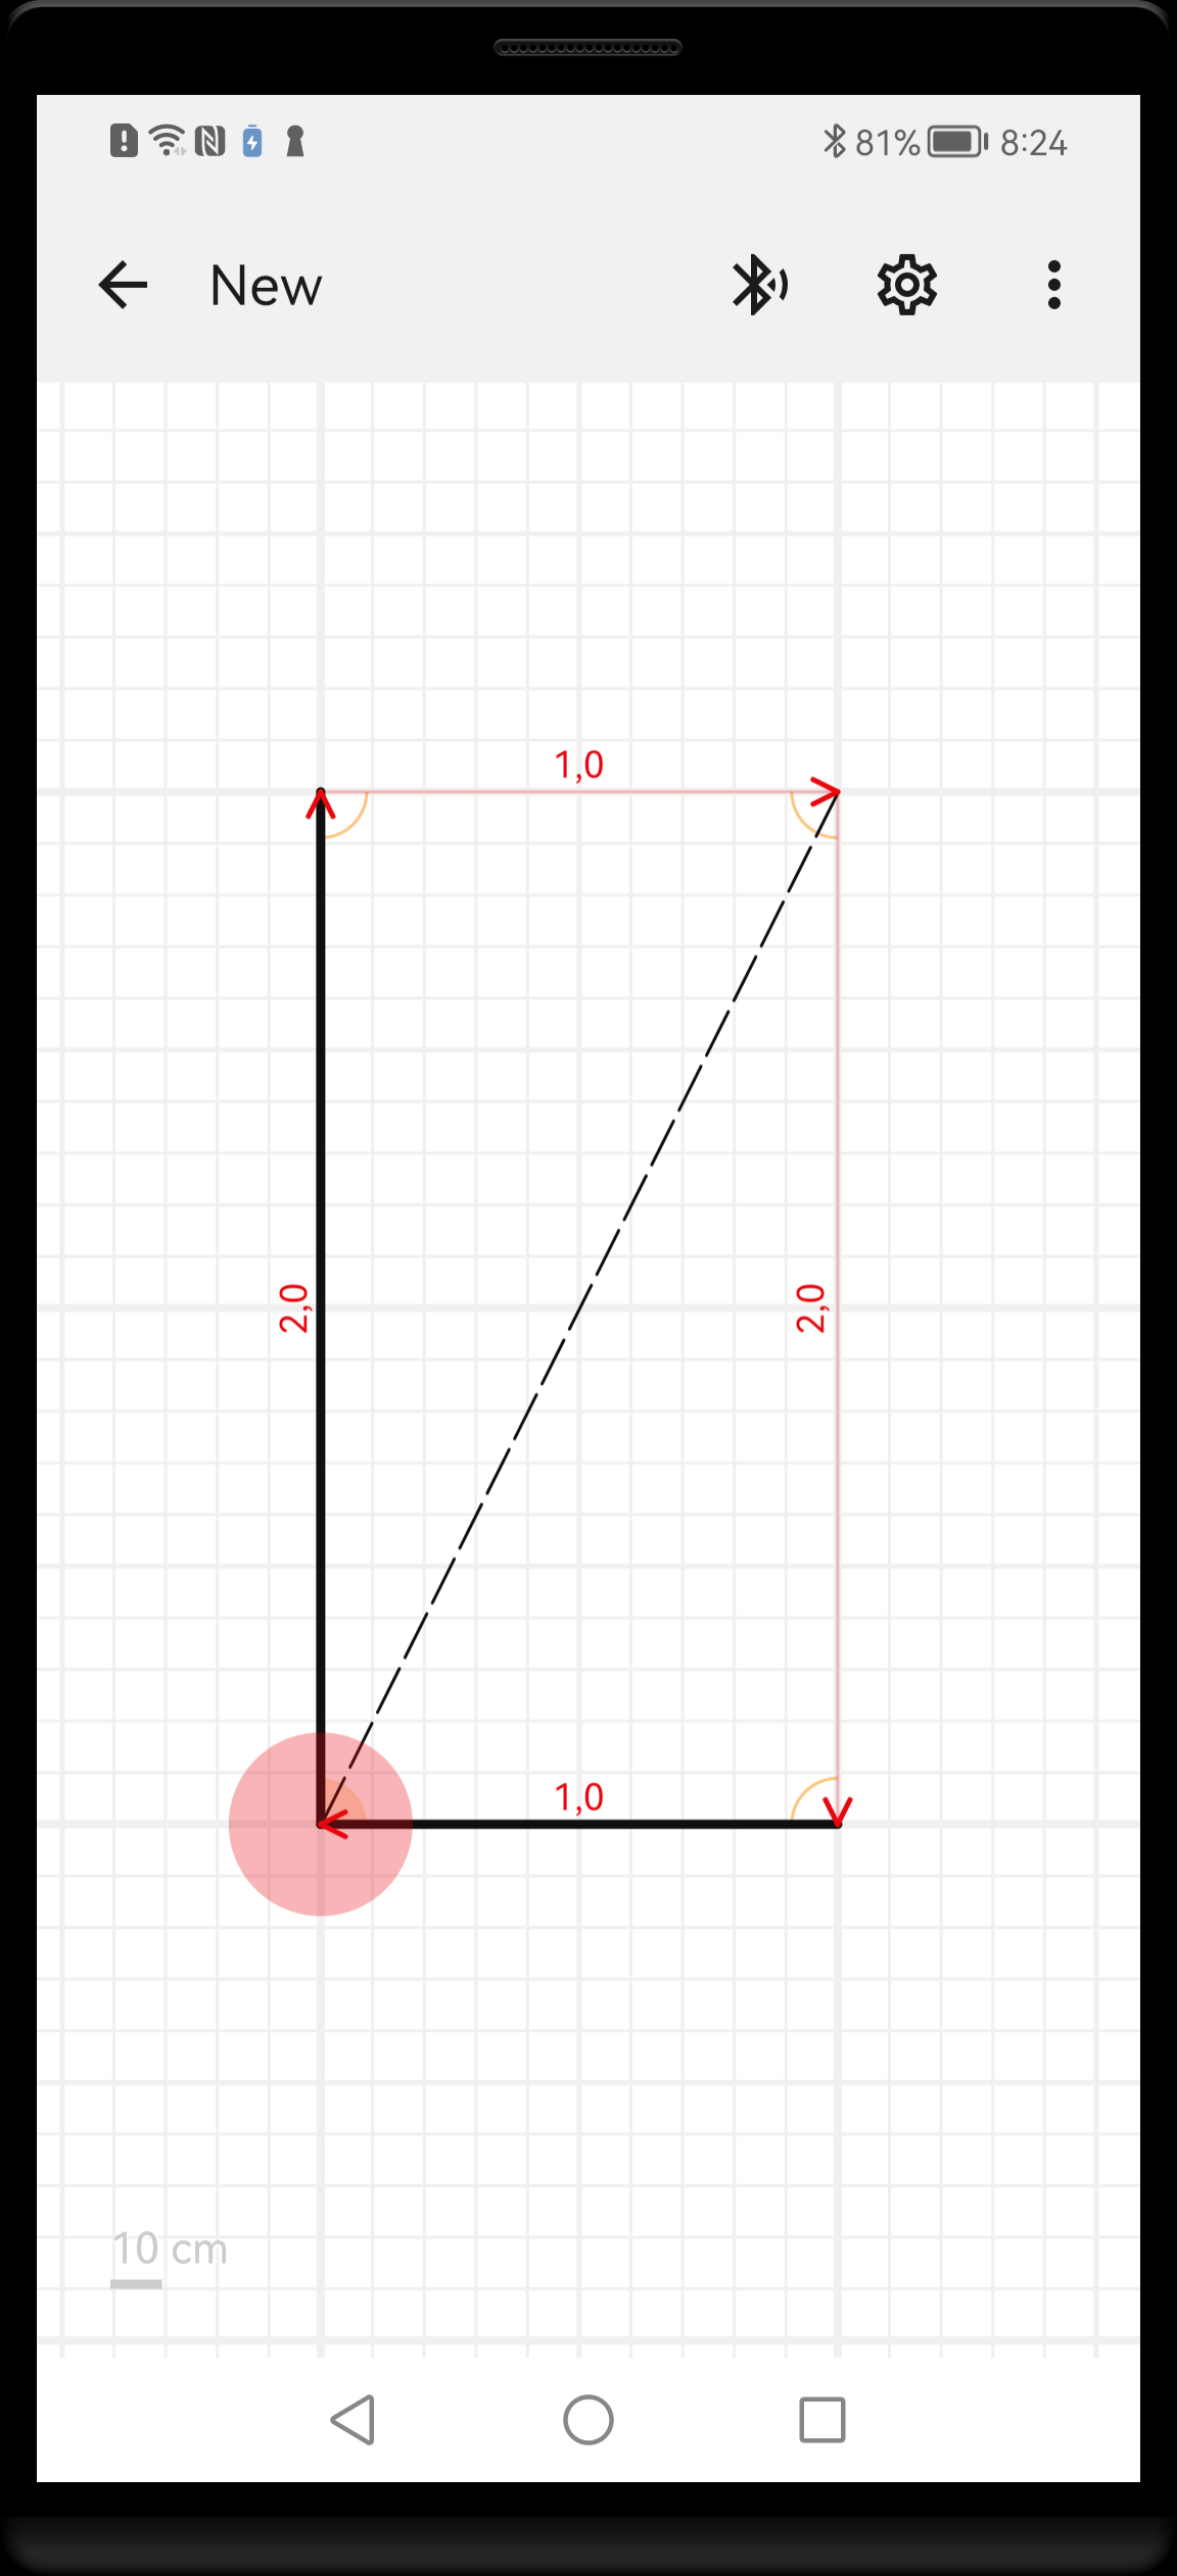
Various relations between measurements (red lines) and shapes (black lines) in a measured example rectangle. * At the edges left and bottom the shape lines are repeating the measurement lines. * At the edges right and top there are no shapes bound to measurements. * At the diagonal the shape is drawn between opposite corners, but there is no corresponding measurement line.
Automatic line creation
In many cases the Shape lines are simply repeating the measurement lines and can be easily generated by software, for instance when you measure along the walls. While you measure, Lasernote tries to guess whether the measured line should be accompanied by Shape line. Following cases are possible.
- Draw default line – when the plan is empty, a first line will be created with the style “wall”.
- Continue line – when start point lies at free end of existing line, the line will be continued wit the same style and symbol.
- Continue with newer style – when start point lies at junction of 2 different lines – the line with newer style will be chosen to draw.
- No line to continue – when start point lies at junction (corner) of existing lines of the same style or there is no line ending at start point, no line will be drawn.
However, there are also the cases when shape lines need a connectivity pattern that is different from the measurements’ network. It will require deleting, adding and manipulating the shapes by hand, using tools described below.
Add/delete shape
To draw a new shape, first you have to choose one measurement point (tip of the arrowhead) and long press on it. The selected point will become highlighted and context menu will show up.
- To create new Shape point, choose menu option Draw a point. New shape point will be drawn at selected location with the default style or with last used style if available.
- To create new Shape line, choose menu option Draw a line. Other points will become highlighted allowing for selection of line end point. Single tap on the point where you want the end of the shape line. New line will be created, connecting selected start and end. Ste style of the new line will be chosen using Automatic line creation rules.
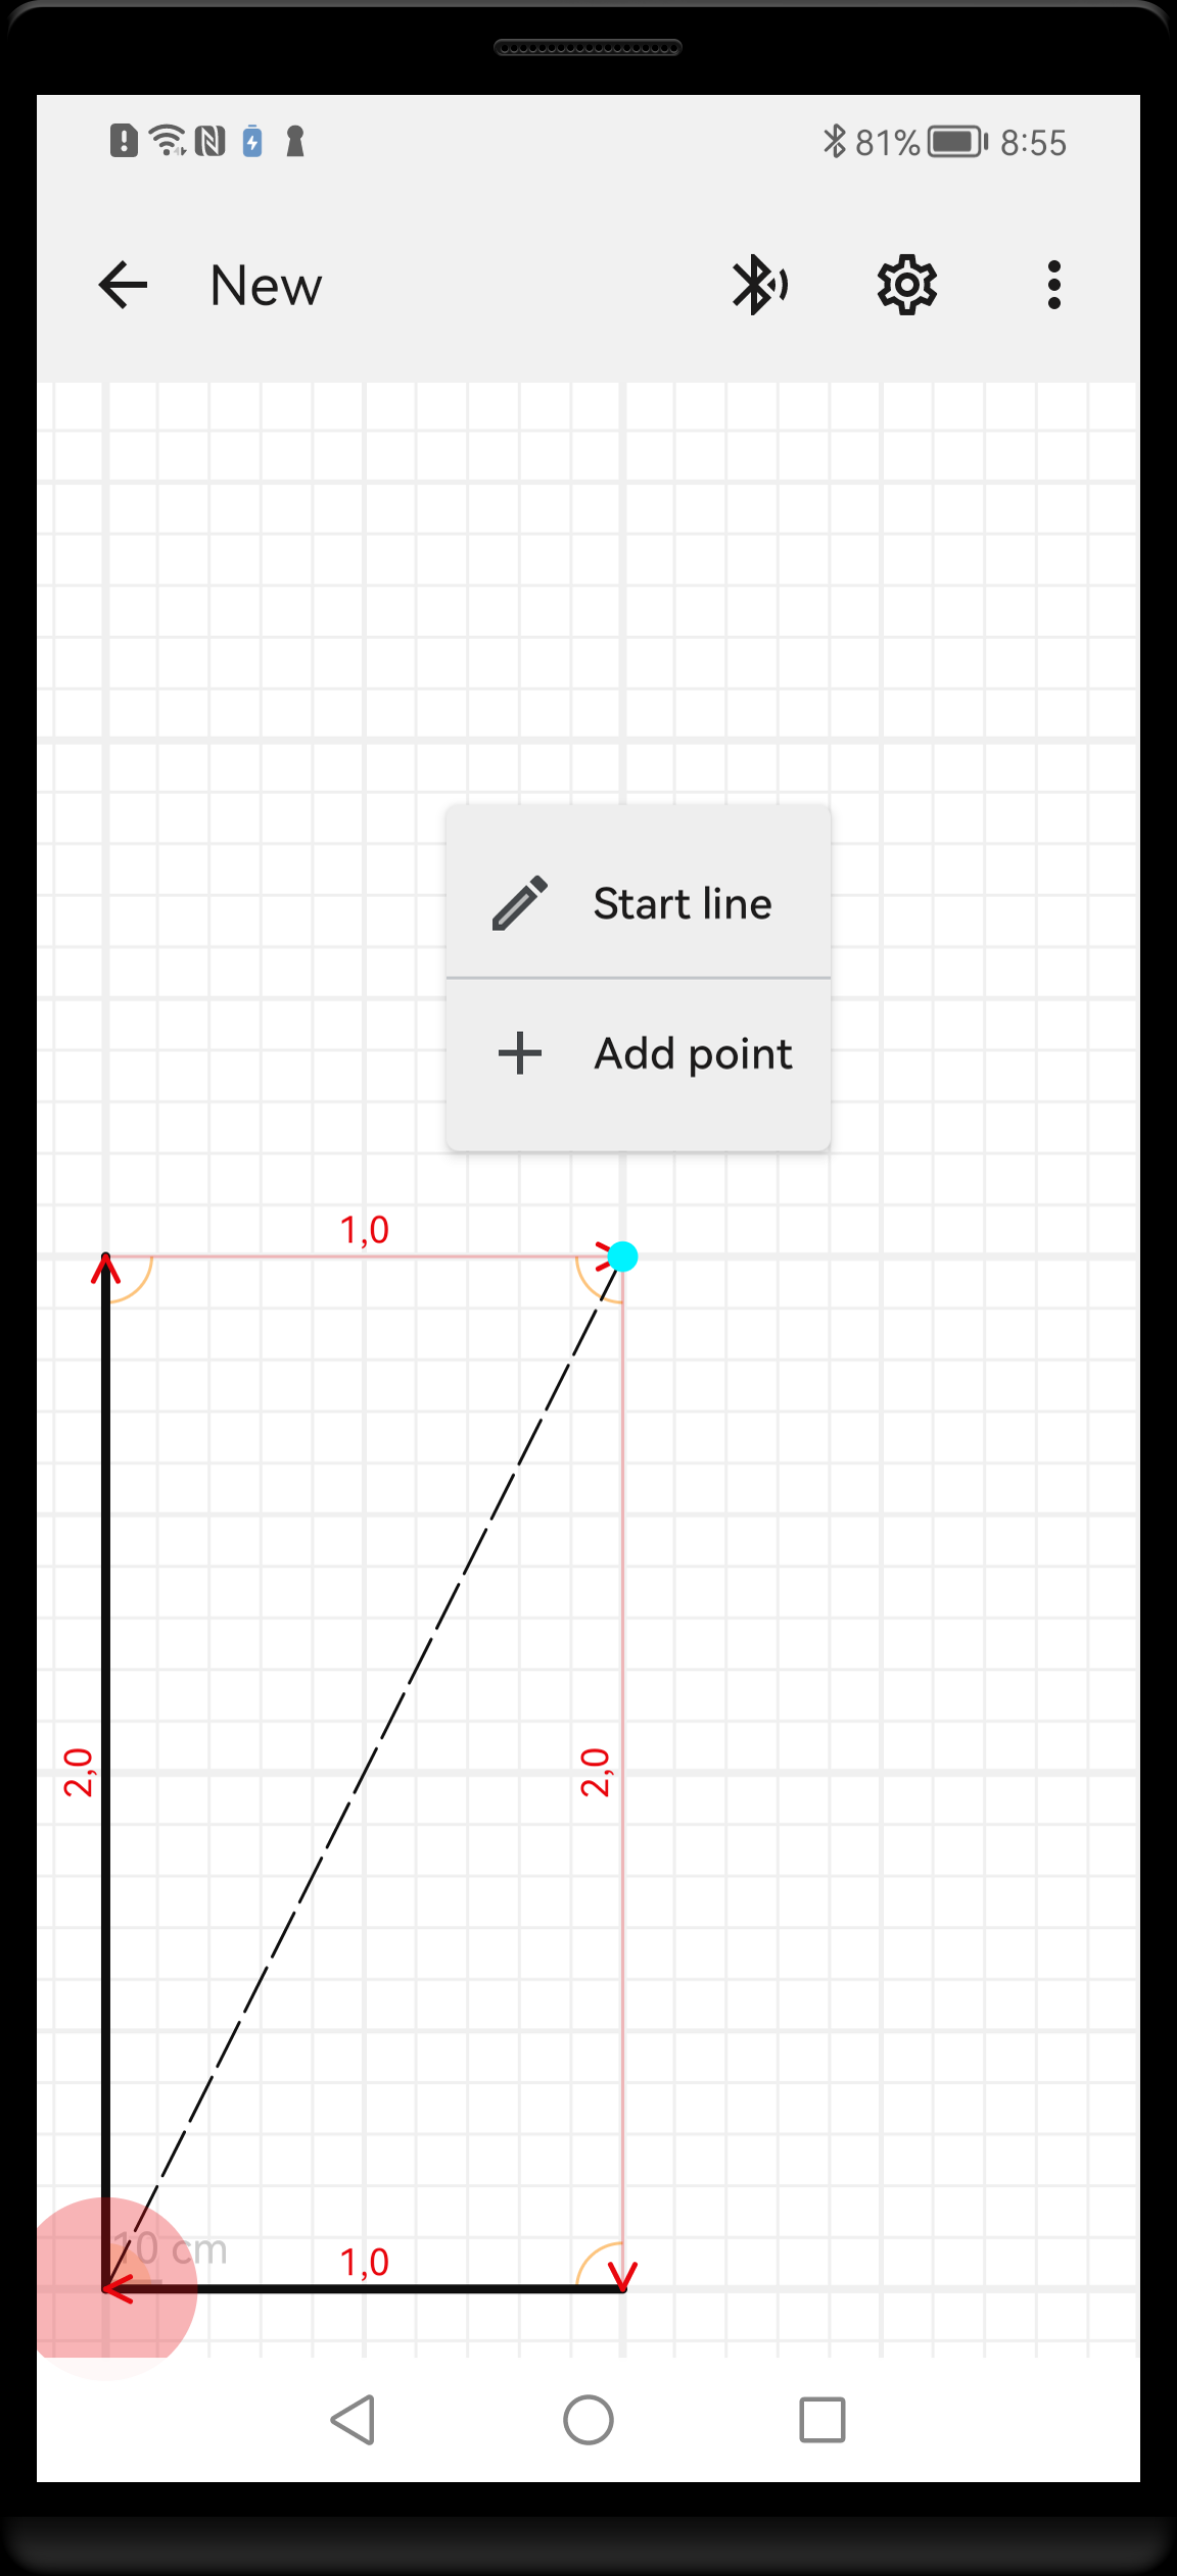
Long press on any measurement point (tip of the arrowhead) opens the context menu that allows to create a new shape, associated with this point.
To delete existing shape, first long press on it. The selected shape will become highlighted and context menu will be displayed. If the highlighted shape is what you intend to delete, choose menu option Delete. The shape will be deleted without further warning.
Shape properties
To access shape properties, first select the shape by long press on it. The selected shape will become highlighted and context menu will be displayed. If the highlighted shape is what you need, choose menu option Line settings or Point settings.
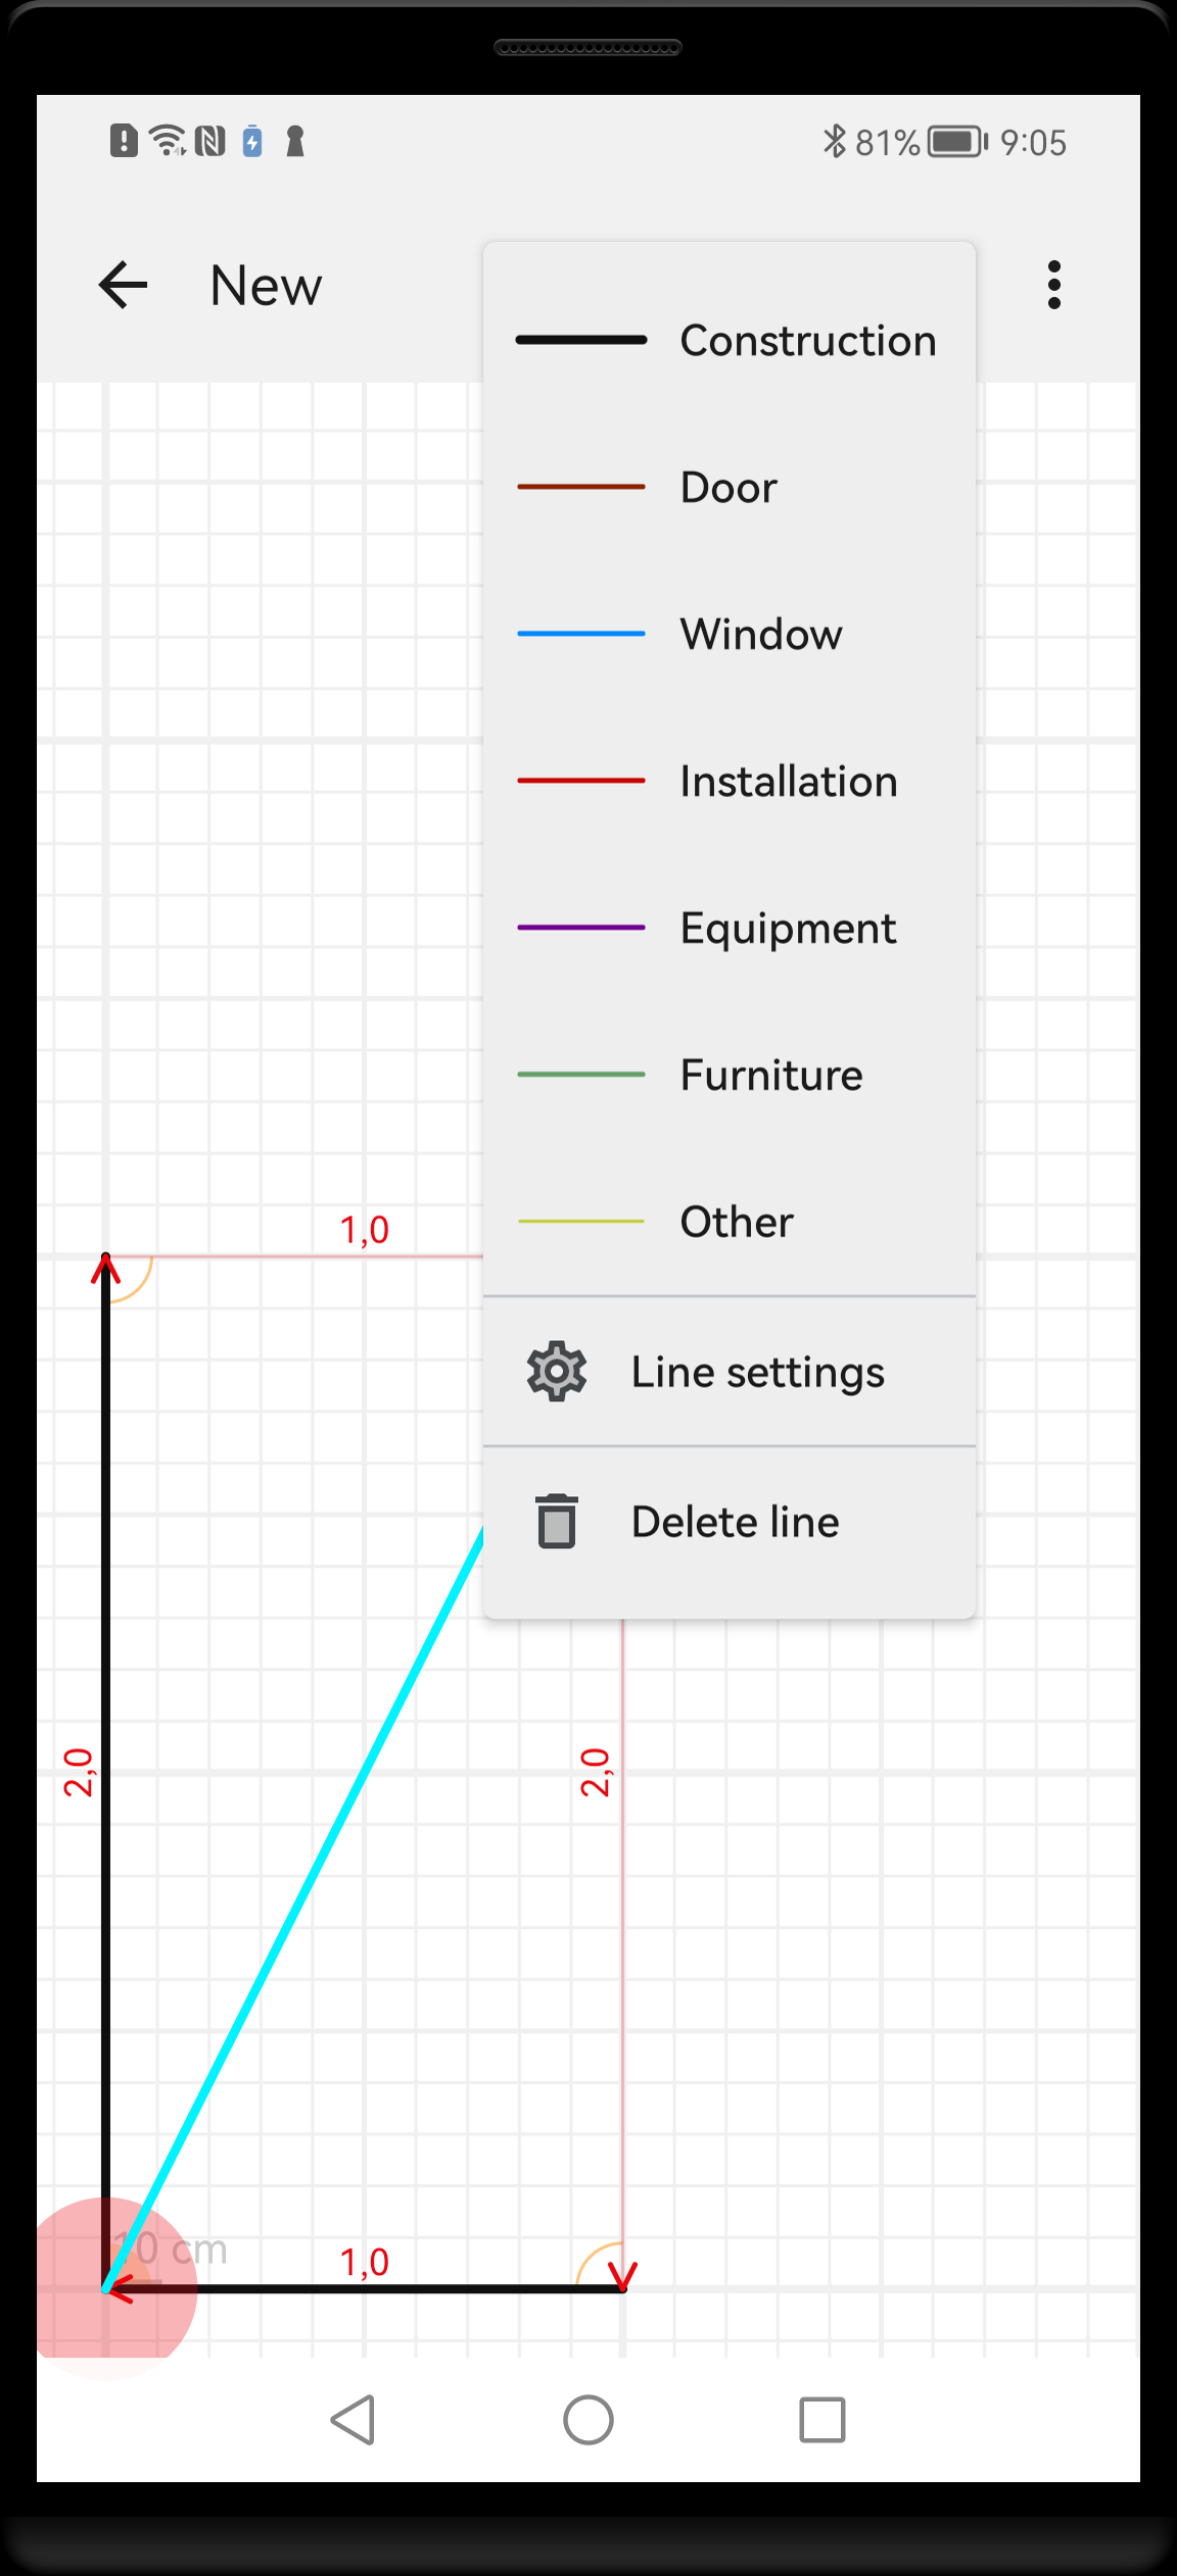
Long press on a line opens context menu that allows to delete the shape or access its properties screen. Some styling options are accessible directly in the menu.
Shape properties screen is organised in groups like other properties’ screens.
- Symbol – controls how the shape is displayed on the screen.
- Dimensions – real dimensions of the object. You are encouraged to use measured values. Depending on selected symbology, some of the dimensions will have an impact on a drawing (for example circle size), others are only for record and may be displayed on plan as numbers. Each dimension is accompanied by corresponding shift. Only dimensions that are relevant to selected object symbology are shown. In general, the following convention is used for dimension naming:
- width – primary horizontal dimension,
- depth – second horizontal dimension,
- height – vertical dimension.
- Label – text description that can be added to the shape (multiline).
How shapes of different types can be styled is explained in detail in Symbology section.
Using tags
Tags allow for annotation of the drawing with text labels placed at arbitrary locations. In contrast to shapes, tags are positioned to X-Y coordinate system and not to measurement points. For this reason, tags positions will not be updated when measurement values are changed. Therefore, it is recommended to place the tags after the major measurements are finished.
Add new tag
To add a new tag, long press at selected position on the drawing. The pressed position must be far enough from the existing shapes, otherwise the closest shape will be selected. A highlighted rectangle will appear showing approximate position of the new tag. If the position is as you need, choose menu option Add tag from the context menu. The dialogue will show up, prompting for a name. Try to keep the name short.
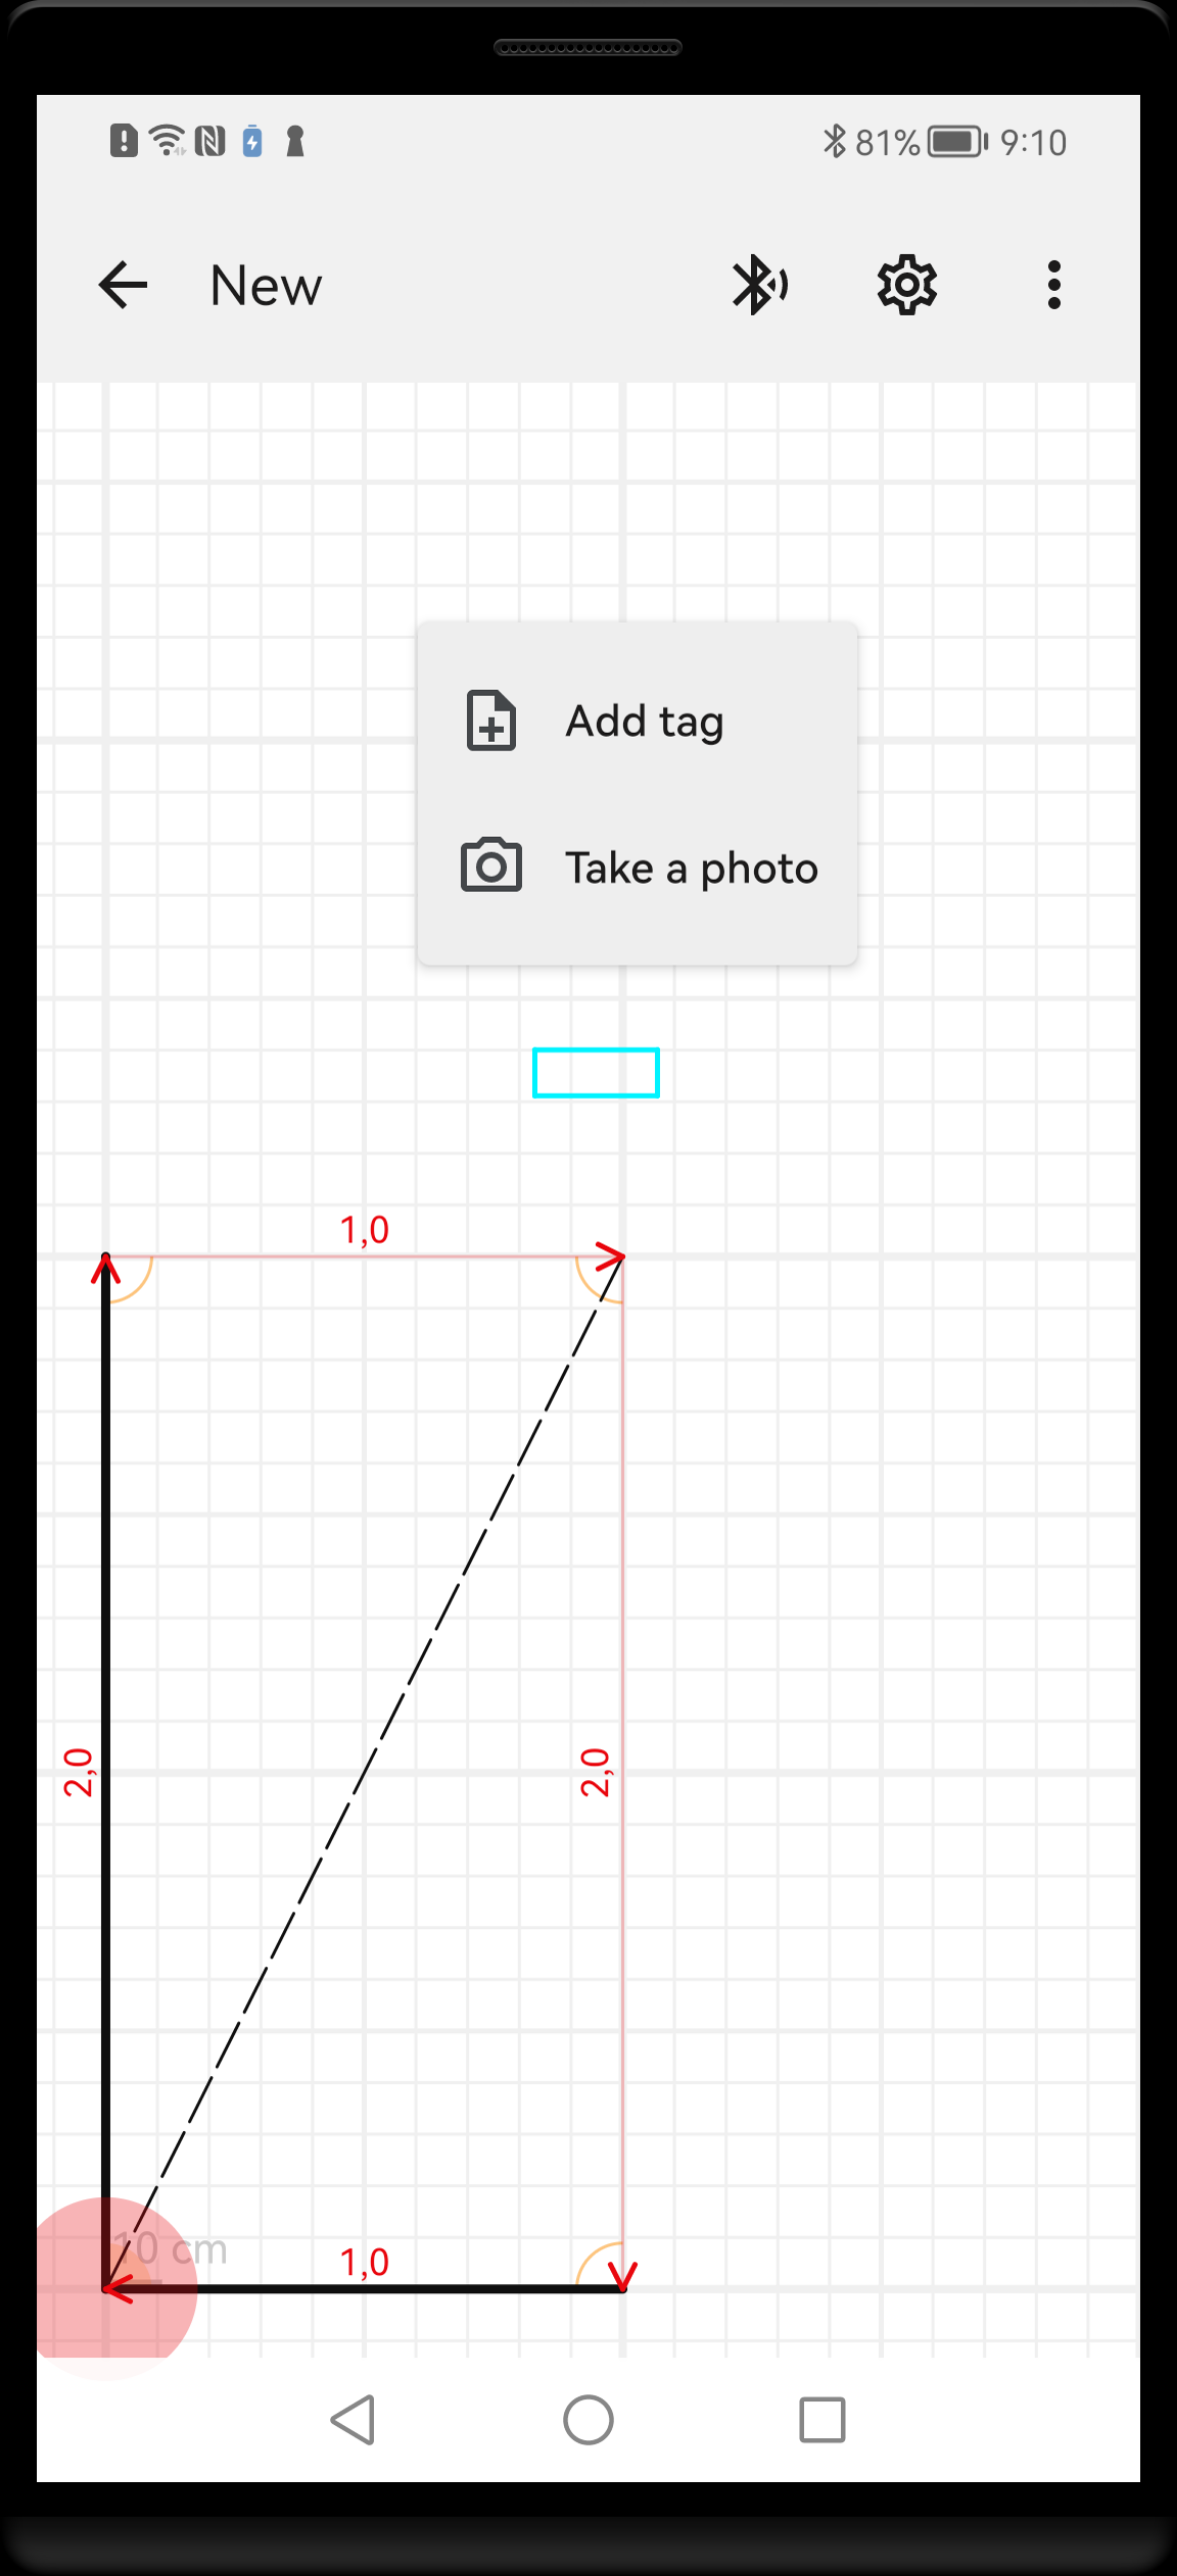
Long press on a background opens context menu that allows to add a new tag or take a photograph.
Delete / move the tag
To delete or move the existing tag, first long press on it’s name. The selected tag’s name will become highlighted and context menu will be displayed. If the highlighted tag is what you intend to delete or move, choose menu option Delete or Move.
The tag will be deleted without further warning.
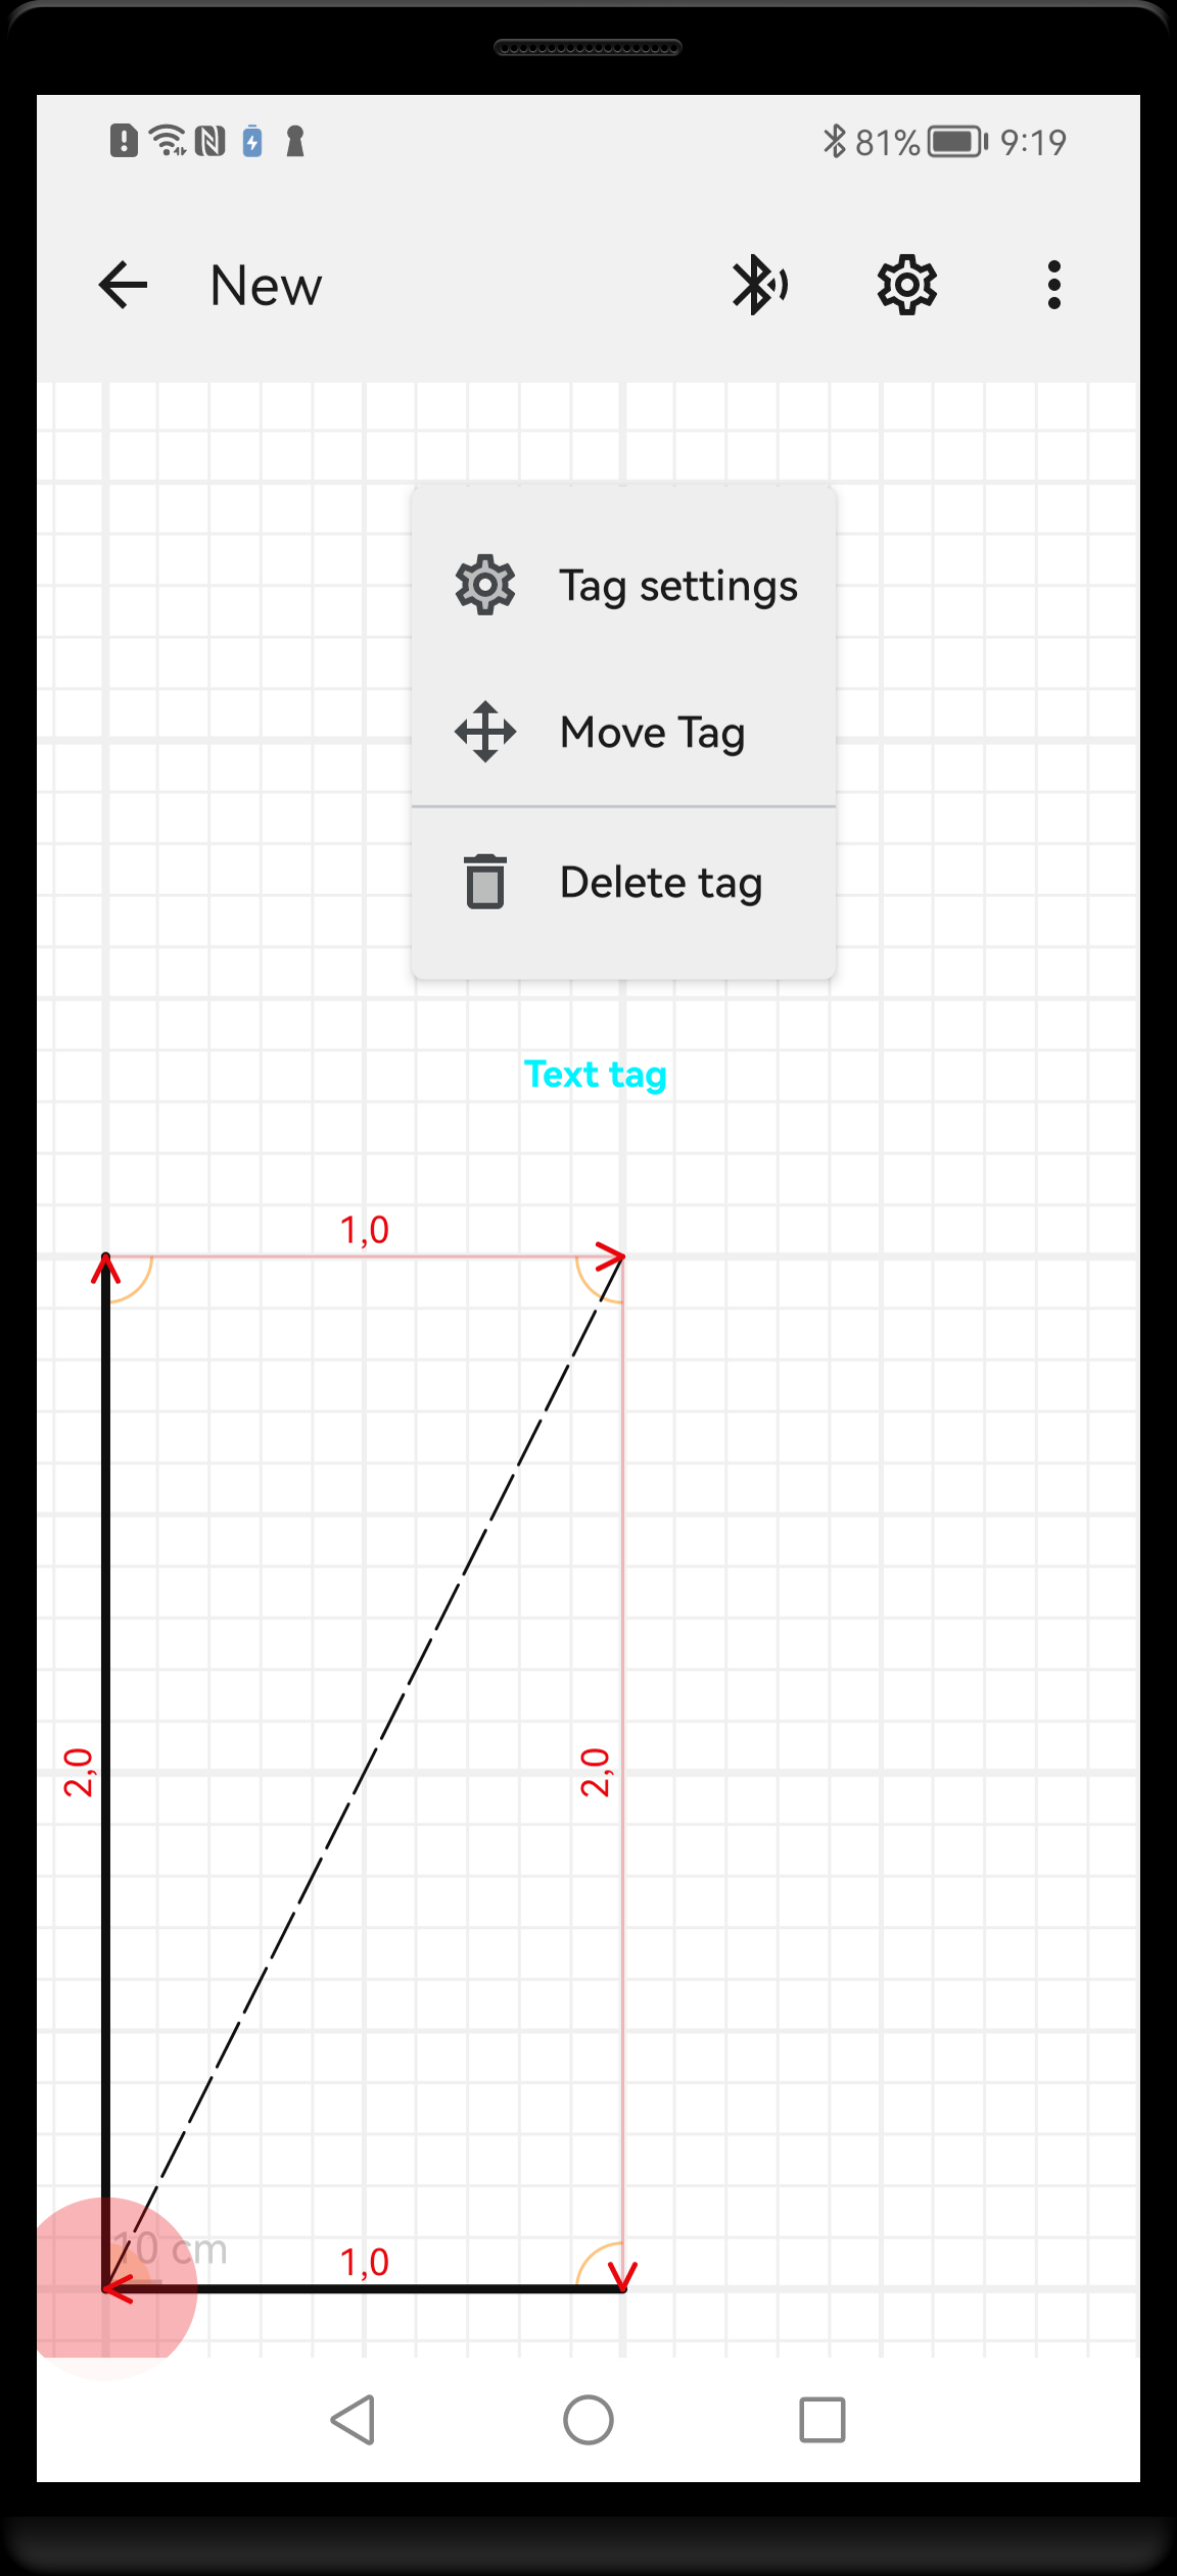
Long press on the existing tag opens context menu that allows to move or delete the tag or access its properties screen.
Tag properties
To access tag properties, first select the tag by long press on it’s name. The selected tag’s name will become highlighted and context menu will be displayed. If the highlighted tag is what you need, choose menu option Tag properties.
Tag properties consist of two items:
- Name – the short, single line text displayed in bold,
- Text – additional text displayed below Name in normal font weight, can be multiline.
Using images
You can use built-in camera to take pictures of the locations of interest and save them into device’s memory. The plan will get annotated with the picture icons.
Add new image
To take a new picture, first long press at selected position on the drawing. The pressed position must be far enough from the existing objects, otherwise the closest shape or tag will be selected. A highlighted rectangle will appear showing approximate position of the new picture icon. If the position is as you need, choose menu option Take picture from the context menu. It is similar to adding tags.
The system camera picker will be displayed. Take the picture in a usual way and accept it. The picture will be saved to the device memory and an Image screen will be shown.
Delete / move the image
To delete or move existing image, first long press on it’s icon. The selected image’s icon will become highlighted and context menu will be displayed. If the highlighted image is what you intend to delete or move, choose appropriate menu option Delete or Move.
The image will be deleted without further warning.
Measure on the image
The objects on the image can be measured and the dimension arrows can be drawn. The red measurement cursor is used in a similar way as on the plan. Double tap on the image to place the cursor at the starting point. Then drag the cursor in the desired direction to draw dimension line. After the line was drawn, the distance value can be entered from laser measure or keyboard. To edit existing dimension, tap on the distance value displayed above the line central point and distance entry box will appear on the bottom of the screen.
Image screen with the picture displayed together with the added dimension. Measurement bar at the bottom can be activated by tapping on a distance label.
You can move the ends of the existing dimension lines by long press on the arrowheads. The arrow will get highlighted and the arrow tip can be moved by dragging on the screen.
Plan views
In order to work comfortably with measurements, shapes and tags as different data layers, the corresponding Plan views are provided: Measurement view for measurements and Plan view for shapes and tags. Most of the time you will work in a special composite view called Standard view, containing the key features of all data layers. You can switch between the views using context menu that expands after double tap on the screen.
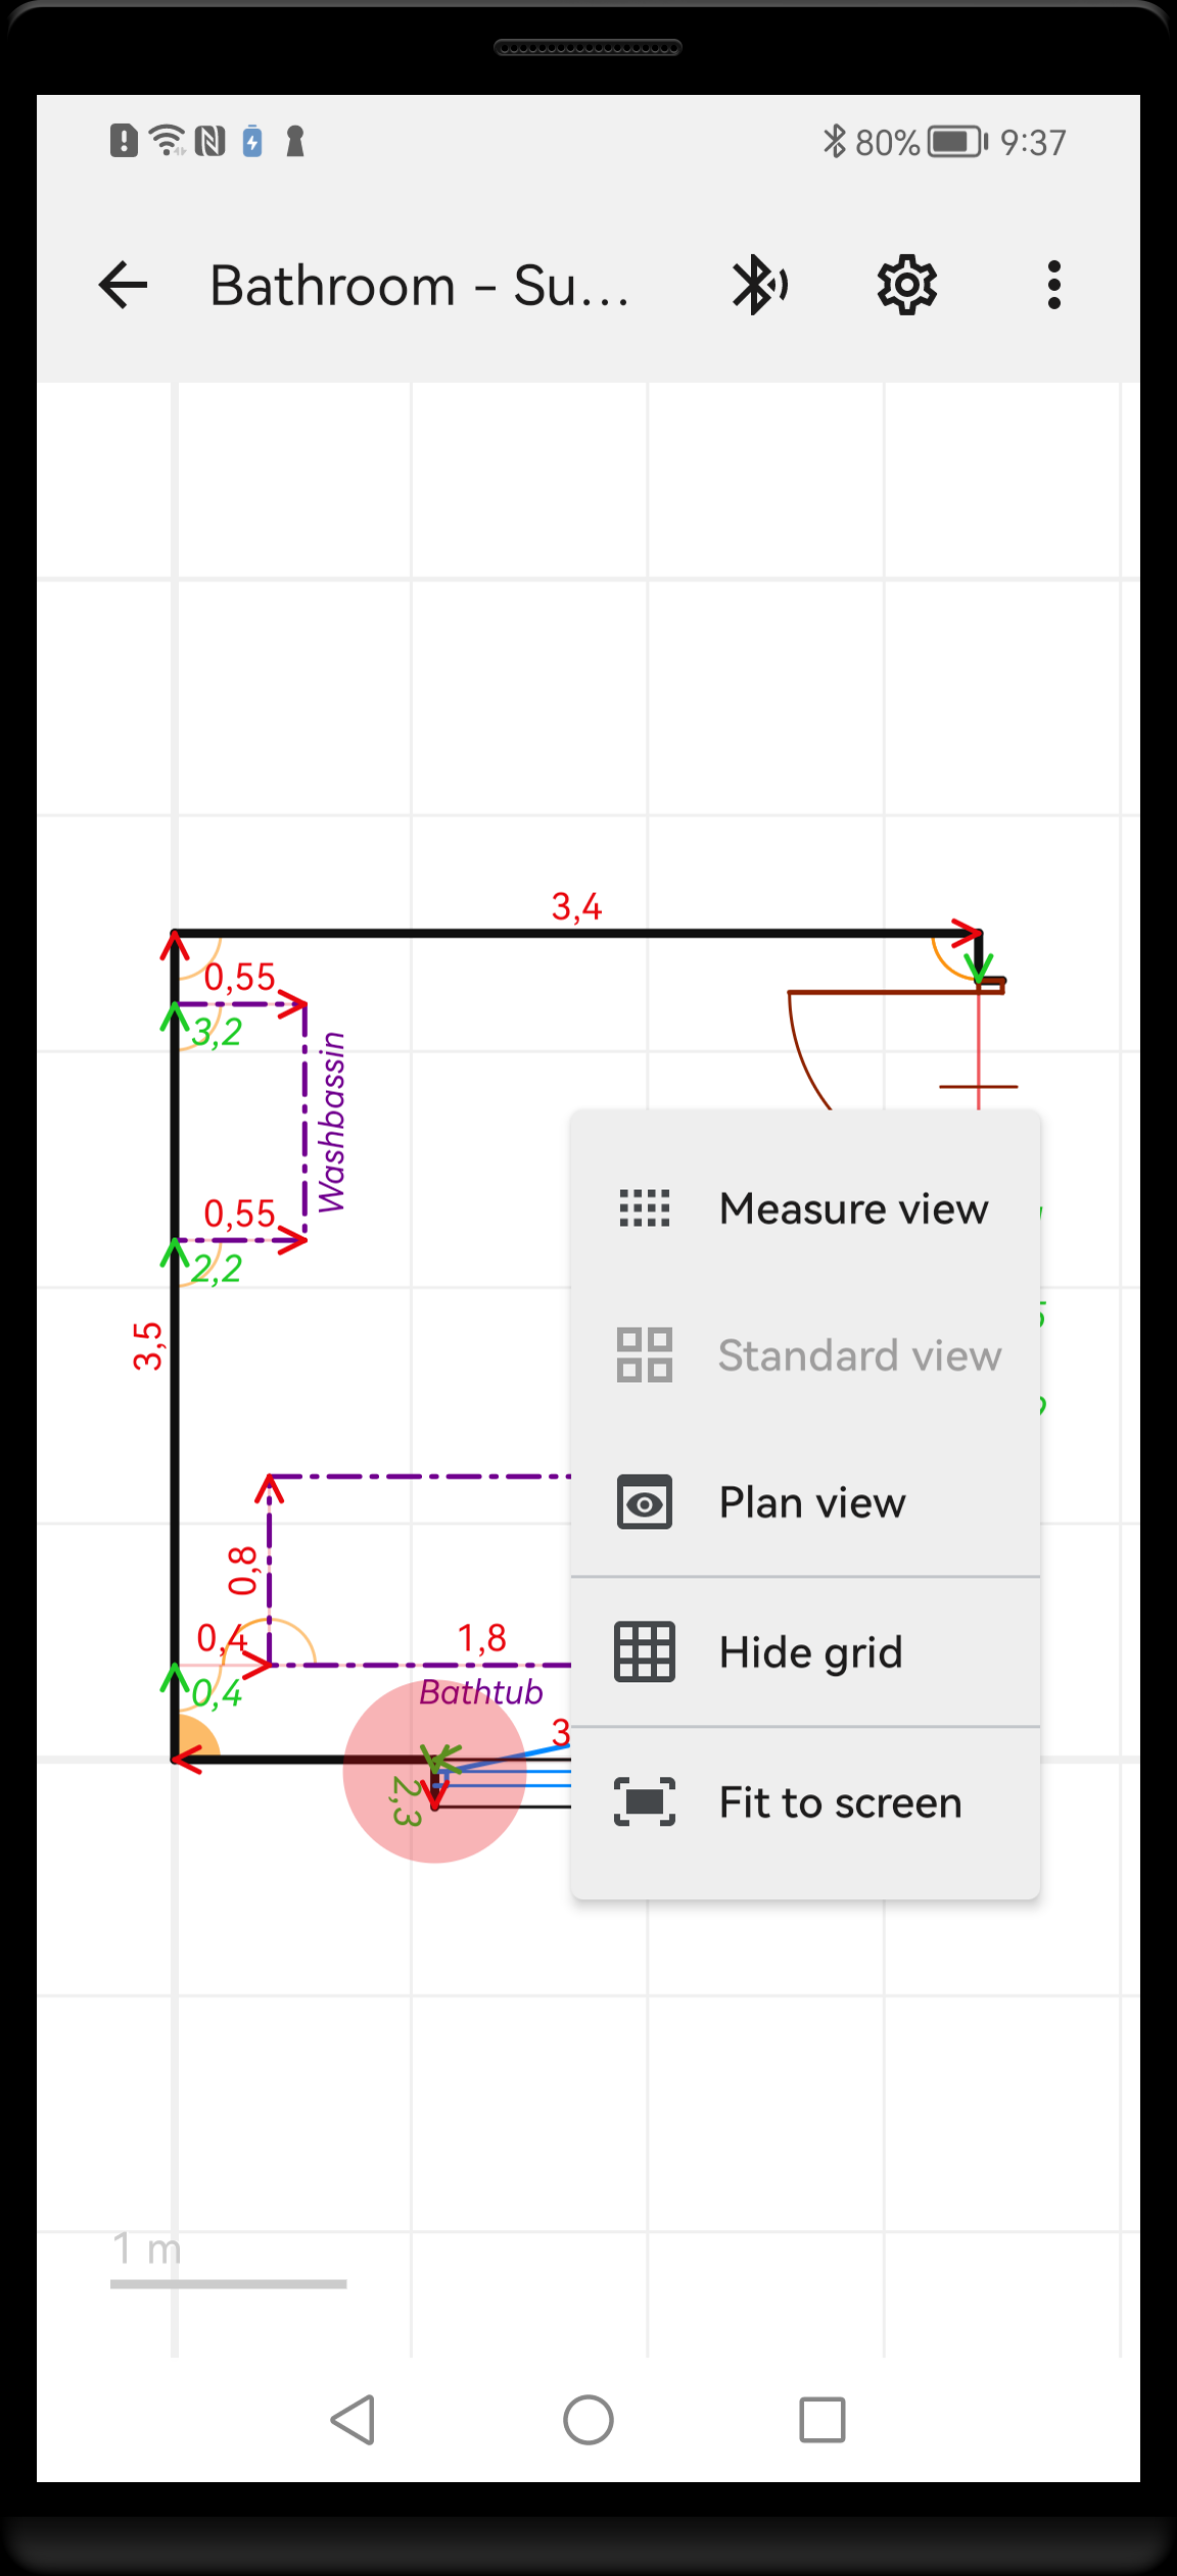
Double tap somewhere within the background opens context menu with commands related to view.
Measurement view
In Measurement view, measurement lines and points are displayed with corresponding distance and angle labels. The shapes and tags are not shown and it is not possible to edit them. You can conduct measurements and change values of distances or angles. While adding measurement lines, the shape lines will be added in background according to the Automatic line creation rules.
Measurement view can be useful in cases, when there is a need to check some details of the measurement course, but they are obscured by overlying shapes.
Standard view
In Standard view, measurement lines and points are shown together with shapes. User can conduct measurements and edit distance or angle values, as well as add or edit shapes and tags. It is default view, intended for regular survey work on site.
Plan view
In Plan view, shapes and tags are displayed, while measurement lines and points are hidden. All measurement tools are inactive in this view. You can add and edit shapes and tags.
Some new features are added in this view, that are not present in other views. Dimension lines and values are shown. As the automatic dimensioning system is not perfect and for some large plans it may give unwanted results, it is possible to switch it off in Plan properties. Independent from automatic dimensioning, Live dimensioning function is active in Drawing view. Line dimensions are shown after tapping on any shape line. To display dimensions between arbitrary points you need to select them by tapping at start and end. If the dimension line is sloped, additional dimensions are projected at X and Y axes, together with respective angles. Area of created rectangle is shown below.
Working with files
Load and save data
Plans are stored in a database that is not freely accessible or usable outside of Lasernote application. If you need to store the data for use in another device or for backup, you can write the plan to file. In a Main screen, long press on selected plan and from the context menu choose the command Save to file. The system SAF file picker will show up to assist you with saving file to device storage. The details of file saving and sharing behaviour are under control of device operating system and will differ between system versions and makes.
To load external file from device storage into Lasernote, use Load plan from file action icon in Main screen toolbar.
Export
The site plan created in Lasernote can be exported to the formats readable by external programs on mobile or PC devices. Export dialogue can be called from Plan screen by tapping on Export plan action icon from the toolbar.
Created files are managed by system SAF and system sending panel. If you choose to send a file as an e-mail attachment, the e-mail address from app settings will be used. Message body and subject will be composed based on plan metadata.
The initial scale, page size and orientation will be calculated according to the size and detail density of the actual plan. Any of these parameters can be modified by user; other parameters will be automatically updated, so that the plan stays fitted to the page format. The resulting PDF document will contain frame with binding margin and title block.
JPG
The initial scale will be calculated according to the size and detail density of the actual plan. Raster resolution is fixed and set to 300 dpi. This format is intended for quick and simple sharing.
DXF
The DXF is a widely used vector exchange format, recognised by most CAD, GIS and graphics programs. In order to mitigate various compatibility issues, Lasernote export filter uses the most basic subformat R12. As various programs make different assumptions about data units, the appropriate option is additionally given for export. The shapes with various display styles assigned in Lasernote are exported to separate DXF layers.